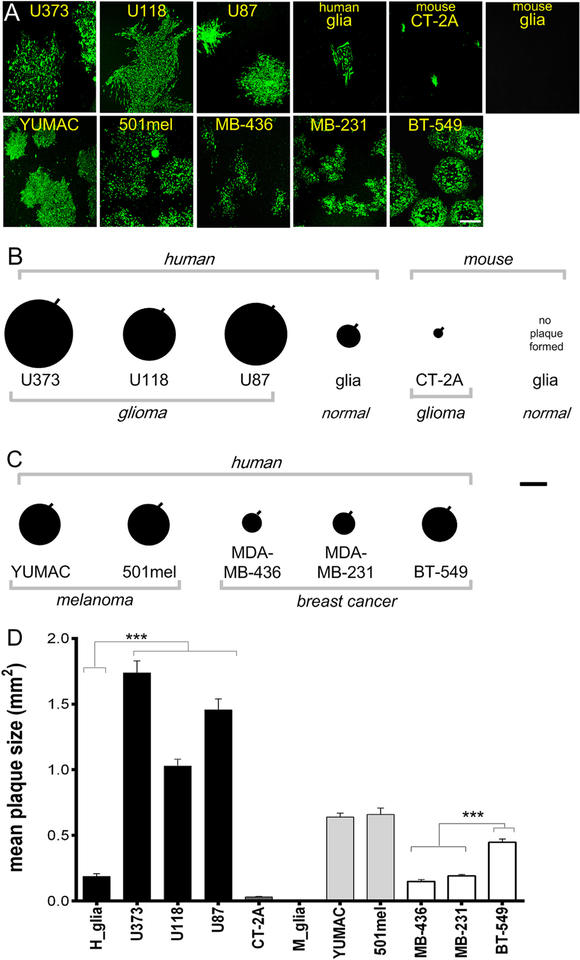
Fig. 2. Glioblastoma cells generate larger VSVΔG-CHIKV plaques than cultures of normal human glia.
A. Representative immunofluorescent images of viral plaques that developed 3 days post infection of monolayer cultures of human glioma (U373, U118, U87), mouse glioma (CT-2A), human melanoma (YUMAC, 501mel), human breast cancer cells (MDA-MB-436, MDA-MB-231, BT-549), and normal human glia (H glia) and mouse glia (M glia). Scale bar 0.5 mm. B. Plaque size was measured as an indicator of viral propagation in human and mouse glioma. Each black circle shows the mean size of 20 randomly selected plaques with the SEM indicated by the black line on the upper right of each circle. C. Plaque sizes measured in human melanoma and breast cancer cells. Scale bar 0.6 mm. D. The bar graph shows the mean plaque size. Values are reported as the mean +/− SEM; n = 20. ***p < 0.001, one-way ANOVA with repeated measures.

