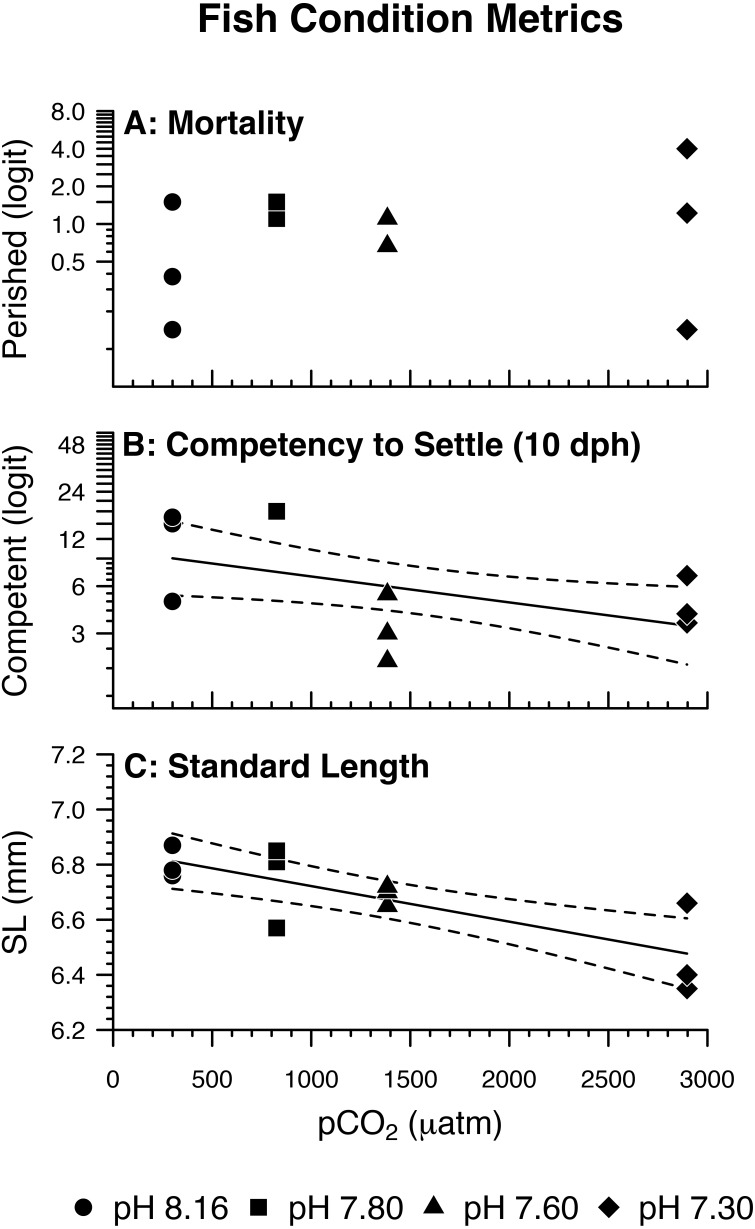
Figure 4. Fish condition metrics.
(A) Odds of Amphiprion clarkii mortality by pH/pCO2 treatment (legend). Regression lines (solid) and 95% confidence bands (dotted) represent significant relations between pH/pCO2 treatment and (B) odds of on-time A. clarkii settlement (p = 0.0279); (C) A. clarkii standard length (p = 0.0018). Data points represent (A, B) binomial proportions by aquarium; (C) aquarium means. N = 12, n = 3 except where (B) 100% of fish in an aquarium settled on time (N = 10, n = 1 for pH 7.80 treatment only).

