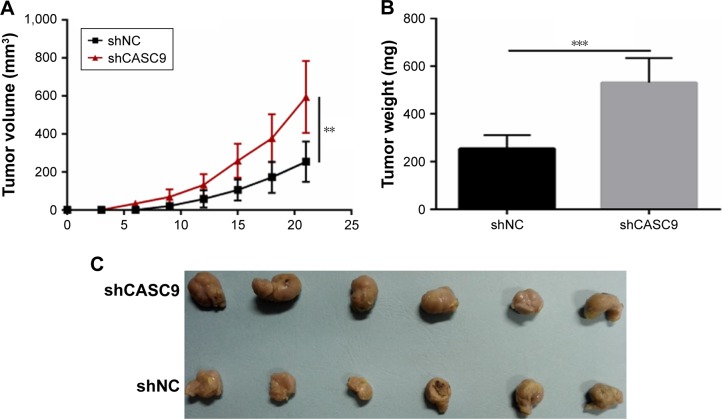
Figure 6.
Downregulation of CASC9 inhibited cell growth in vivo.
Notes: (A) Tumor growth curves were established by detecting tumor volume every 3 for 21 days after injection. (B, C) Tumor weights isolated from nude mice in each treatment group were determined on day 21 after injection. Data are presented as the mean ± SD. **P<0.01, ***P<0.001.
Abbreviation: NC, negative control.

