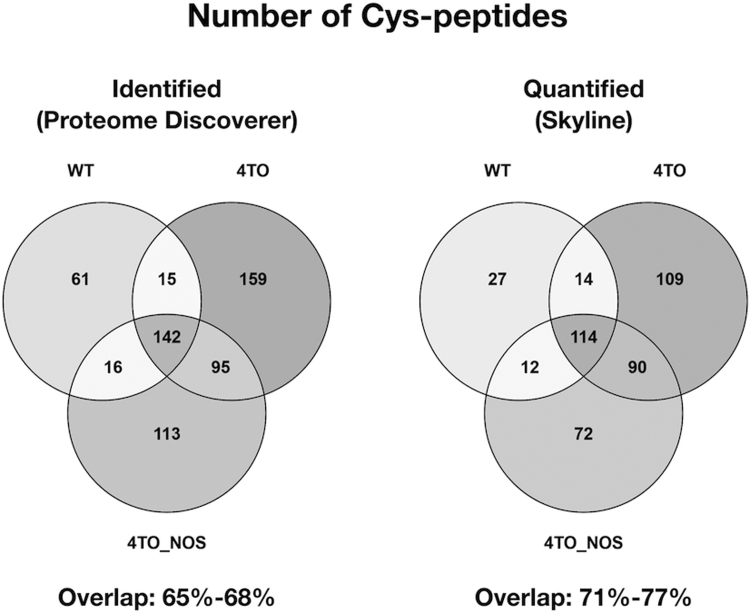
Fig. S2.
Distribution of identified and quantified Cys-peptides between the different samples. Venn diagrams have been drawn with the lists of identified peptides (those unambiguously ascribed by the Proteome Discoverer search engine) and quantified peptides (those selected by the Skyline software for quantitative analysis) in the three different cell types studied. The range of overlapping percentage is also indicated.

