Fig. S2.
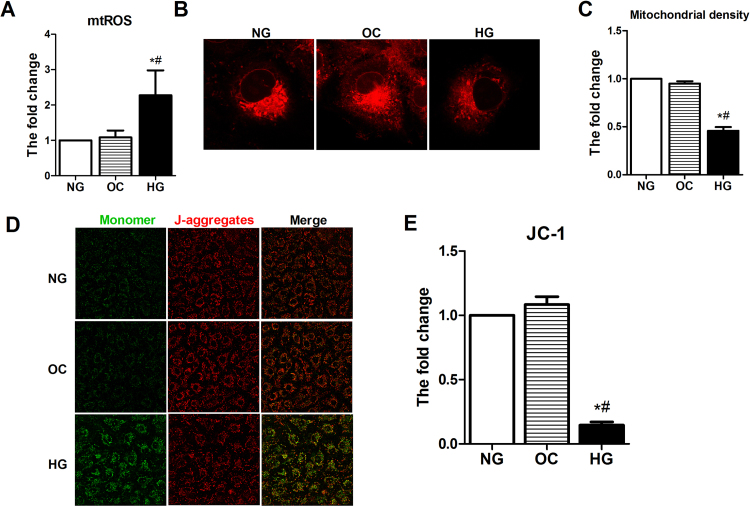
Hyperglycemia induces mtROS production and mitochondrial impairment in endothelial cellsin vitro. A) Mitochondrial superoxide was measured by flow cytometry. HUVECs were incubated in Hanks' balanced salt solution containing 5 μmol/l MitoSOX for 15 min. n = 3. B) Representative images of MitoTracker Red staining showing the mitochondrial morphology in each group of cells (original magnification ×63). C) Mitochondrial density was quantified. n = 3. D) Representative images of JC-1 immunochemistry staining showing the mitochondrial membrane potential in each group of cells (original magnification ×63). E) Mitochondrial membrane potential was quantitated as a percentage in the gate. n = 3. *P < 0.05 vs. NG; #P < 0.05 vs. OC.

