
Figure 8.
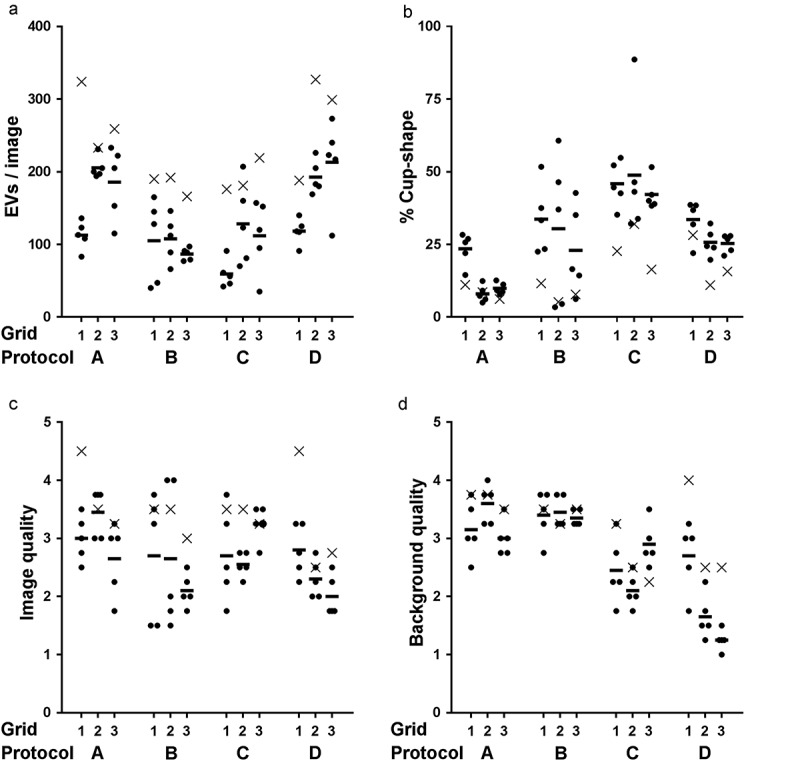
Summary of image properties by protocol and grid. Total number of EV per image (a), % cup-shape of total EVs per image (b), image quality (c) and background quality (d) are shown for the four TEM preparation protocols. Each symbol represents one image. Circles indicate images taken at predefined locations, x indicates operator image selection. Horizontal bar shows the mean value of predefined image locations per grid.