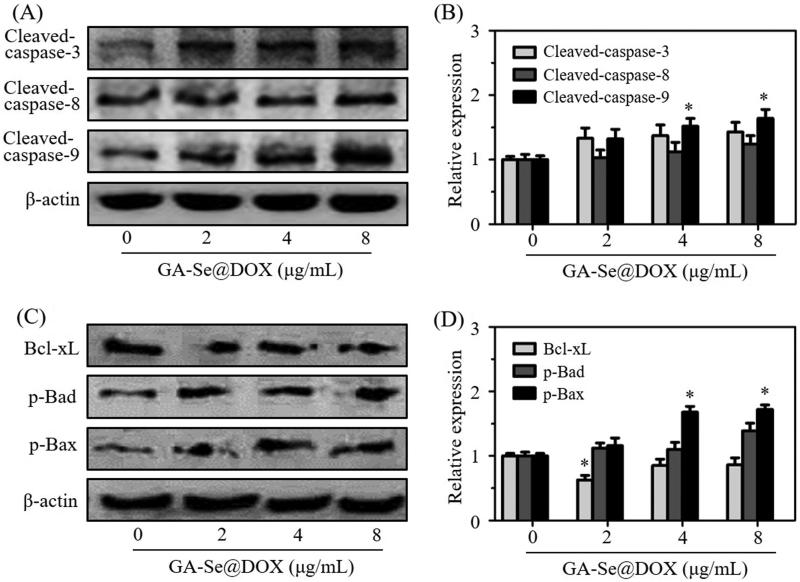
Figure 6.
(A) The protein expression of cleaved-caspase-3, cleaved-caspase-8, and cleaved-caspase-9 in HepG2 cells after exposing to various concentrations of GA-Se@DOX. (B) The semi-quantitative analysis result of cleaved-caspase-3, cleaved-caspase-8, and cleaved-caspase-9 was shown by the histogram. *p < .05 vs. control group. (C) The protein expression of Bcl-xL, p-Bad, and p-Bax in HepG2 cells after exposing to various concentrations of GA-Se@DOX. (D) The semi-quantitative analysis result of Bcl-xL, p-Bad, and p-Bax was shown by the histogram. *p < .05 vs. control group.

