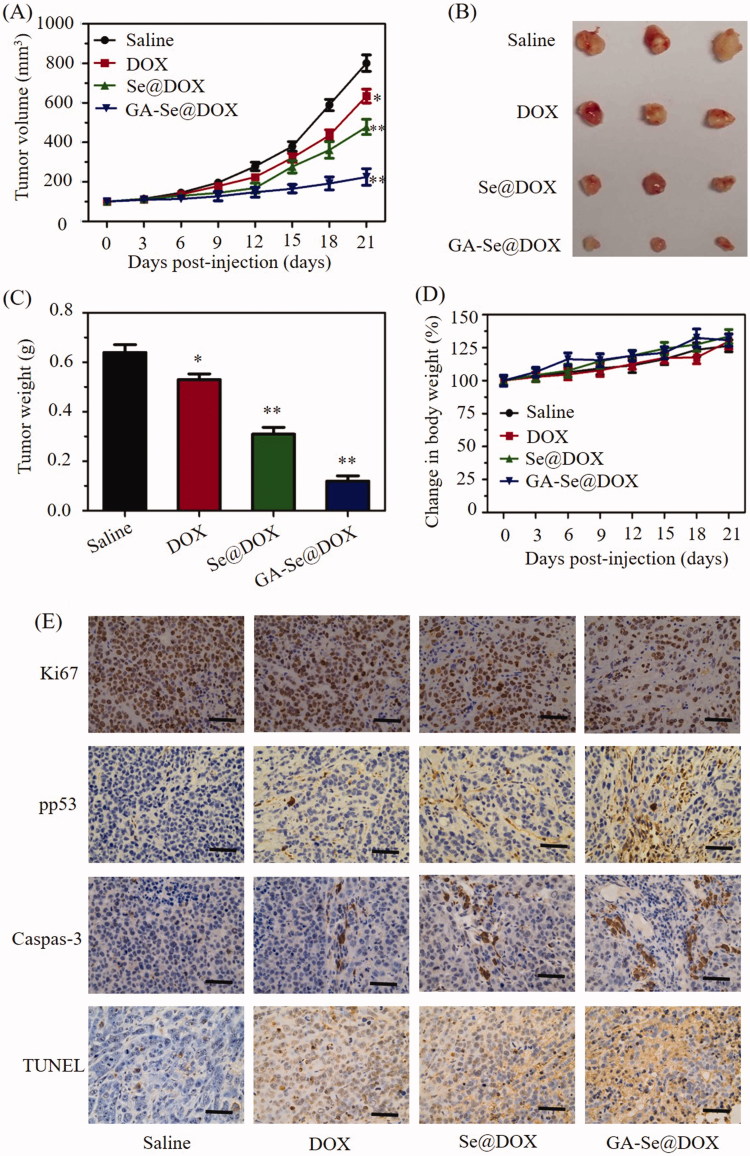
Figure 7.
(A) Tumor growth curve of the xenograft nude mice bearing HepG2 cells after intravenous administration of saline and various formulations of DOX. (B) Morphology of tumors stripped from mice. (C) Tumor weight analysis of mice after 21 days of treatment. (D) Body weight change of mice during the treatment. *p < .05, **p < .01 vs. saline group. (E) Ki67, pp53, caspase-3, and TUNEL immunohistochemistry analysis of tumors treated with saline, DOX, Se@DOX, and GA-Se@DOX. Scale bar is 50 μm.

