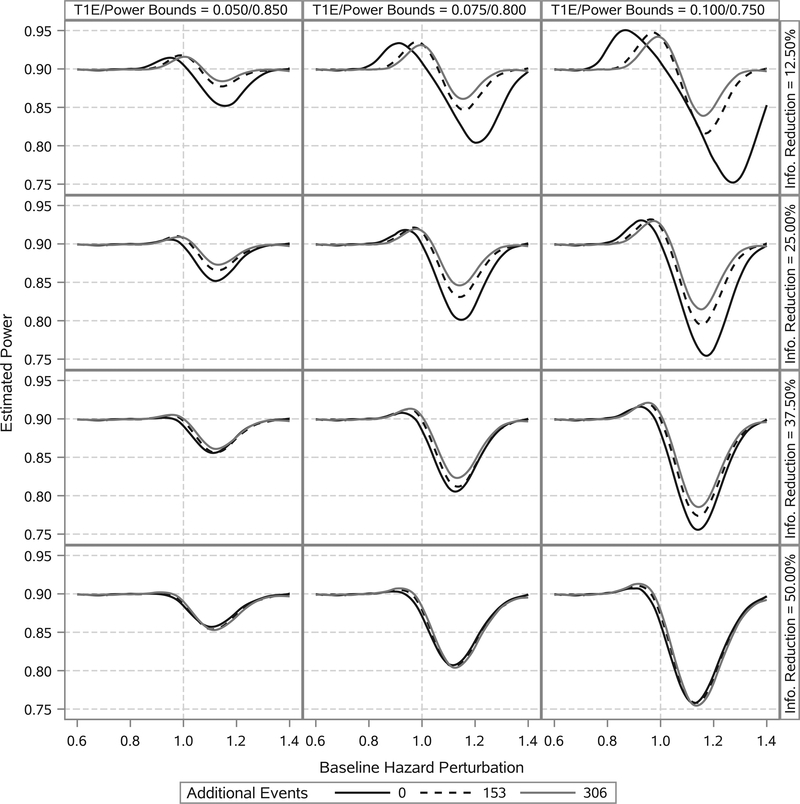
FIGURE 2.
Estimated power as a function of baseline hazard perturbation. Columns correspond to different bounds on the type I error rate (T1E) and power. Rows correspond to different levels of reduction in the total number of events required for the interim analysis opportunity. Curves within a panel correspond to the number of additional events borrowed from the historical trial beyond that required to have an effective number of events equal to 612. Curves are estimated using LOESS methods based on 91 point estimates. Estimates correspond to baseline hazard perturbations ranging from a 45% reduction to a 45% increase. Each point estimate was computed using 100 000 simulation studies

