
Extended Data Figure 3. AβOs reduce FNDC5/irisin levels in hippocampal neurons.
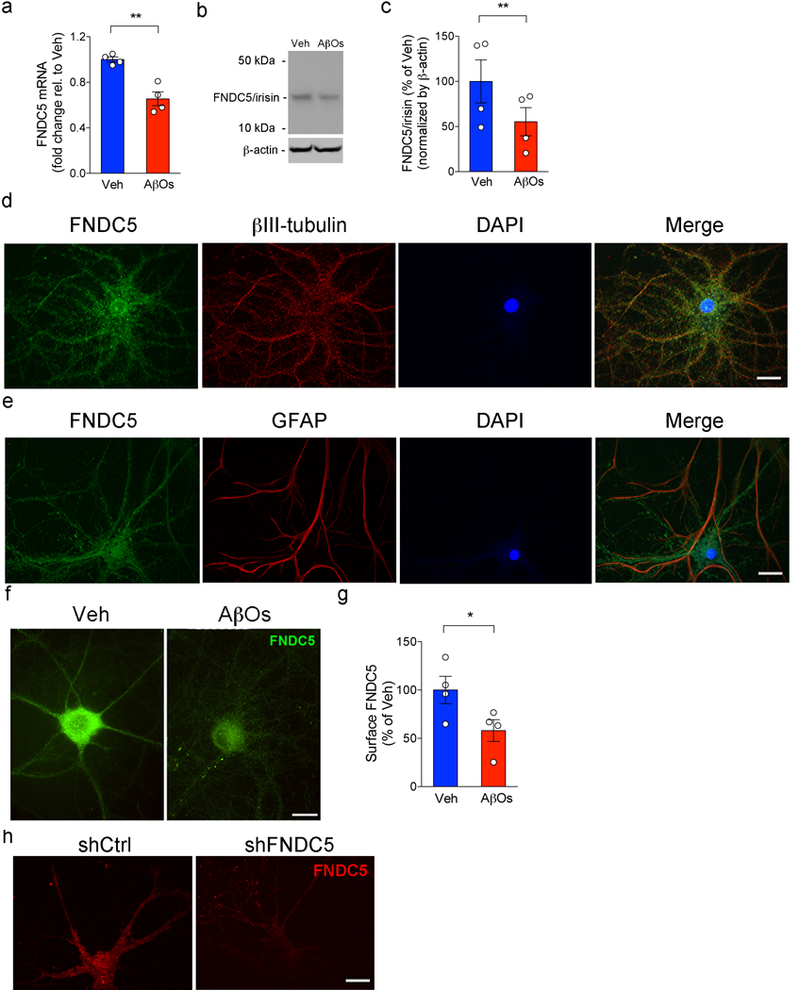
(a-c) Primary cultured hippocampal neurons were exposed to 500 nM AβOs for 24 h. Fndc5 mRNA (a) and FNDC5/irisin protein levels (b,c) in cultured hippocampal neurons exposed or not to AβOs (N = 4 experiments with independent neuronal cultures and AβO preparations; Date are shown as mean ± SEM,**p<0.01; paired Student’s t-test; two-sided). See Source Data 5 for original data. (d,e) Colocalization of surface FNDC5 immunoreactivity (green) with β-tubulin III (red) immunoreactivity in cultured hippocampal neurons (d). Colocalization of surface FNDC5 immunoreactivity (green) with glial fibrillary acidic protein (GFAP) (red) (e). The experiment was repeated 2 times with similar results in independent cultures. (f,g) Primary cultured hippocampal neurons were exposed to 500 nM AβOs for 24 h. (g) Summary quantification of surface FNDC5 immunoreactivity in cultured neurons (N = 4 experiments with independent neuronal cultures and AβO preparations; 30 images (from 2-3 coverlips) per condition per experiment. Data are shown as mean ± SEM *p<0.05, paired Student’s t-test; two-sided). (h) Surface FNDC5 immunoreactivity (red) in 18 DIV cultured hippocampal neurons after lentiviral knockdown of FNDC5 (shFNDC5) (N = 2 experiments with independent cultures; 30 images (from 2-3 coverslips) per condition per experiment). Scale bar = 10 mm.