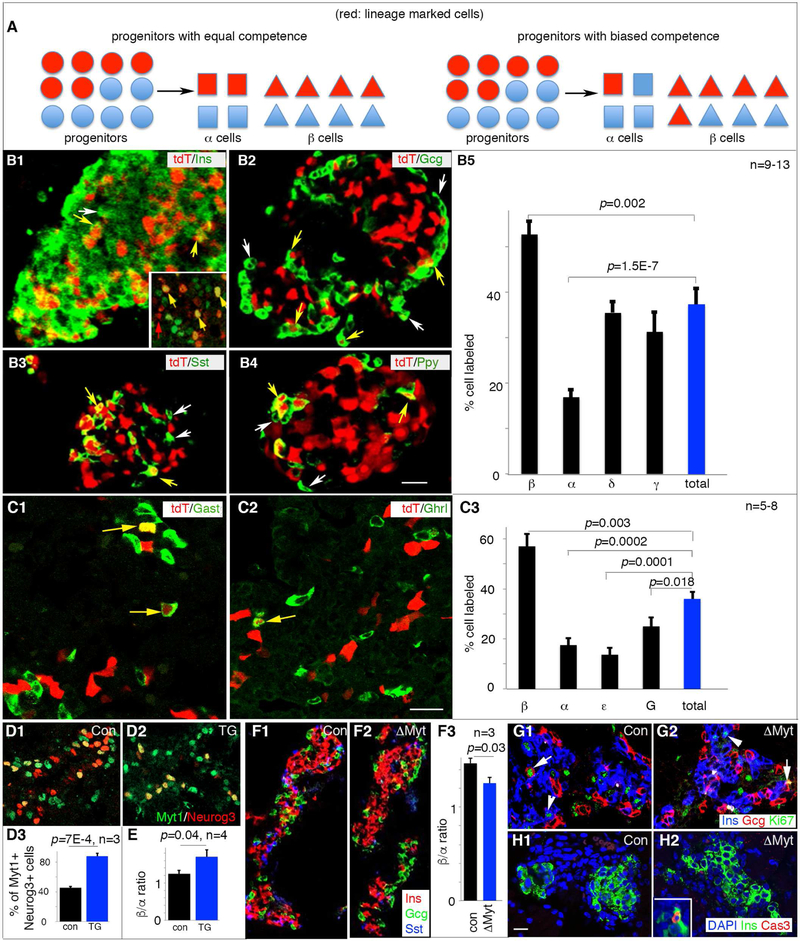
Figure 2. The Myt1+Neurog3+ progenitors are biased toward β-cell fate with Myt1 serving marginal instructive roles.
For all panels with quantification, marked p-values were from t-Test. (A) Diagrammatic explanation of the quantification process. The Myt1+Neurog3+ islet progenitors cells were marked as red (tdT). If the Myt1+ (red dots) and Myt1- (blue dots) Neurog3+ progenitors have equal competence, we expect the portion of each islet cell type expressing tdT to be equal (left half of panel A). If the Myt1+Neurog3+ progenitors are biased toward one cell fate, e.g., β-cell fate, the portion of tdT+ β cells will be over-represented. (B1-5) Hormone staining of tdT+ islets and quantification of tdT+ islet cell types at P1. White arrows, hormone-tdT+ cells. Yellow arrows, hormone+tdT+ cells. Inset in B1, Pdx1 staining in several tdT+ cells. Scale bar, 20 μm. Panel B5 showed (mean + SEM). (C1-3) Hormone staining in tdT+ islets and quantification at E16.5. Yellow arrows, hormone+tdT+ cells. Scale bar, 20 μm. Panel C3 showed (mean + SEM). (D1-3) Myt1-Neurog3 co-expression in Neurog3Myt1OE transgenic (TG) mice at E14.5. Panel D3 showed (mean + SEM). (E) β/α cell ratio in E16.5 control and TG pancreata, presented as (mean + SEM). (F1-3) Ins/Gcg/Sst staining and quantification of β/α cell ratio in E16.5 islets of control and ΔMyt pancreata. (G, H) Ki67 (G) and cleaved-Cas3 (H) labeling of islet cells in E16.5 control or ΔMyt pancreata. Note the cycling Gcg+ or Ins+ cells in both control (G1) and mutant islets (G2) (arrows and arrowheads, respectively). Inset in H2, positive control for Cas3 staining. Images from D-H used identical scales, with bar in H1=20 μm. Also see Figure S2 and Table S3.

