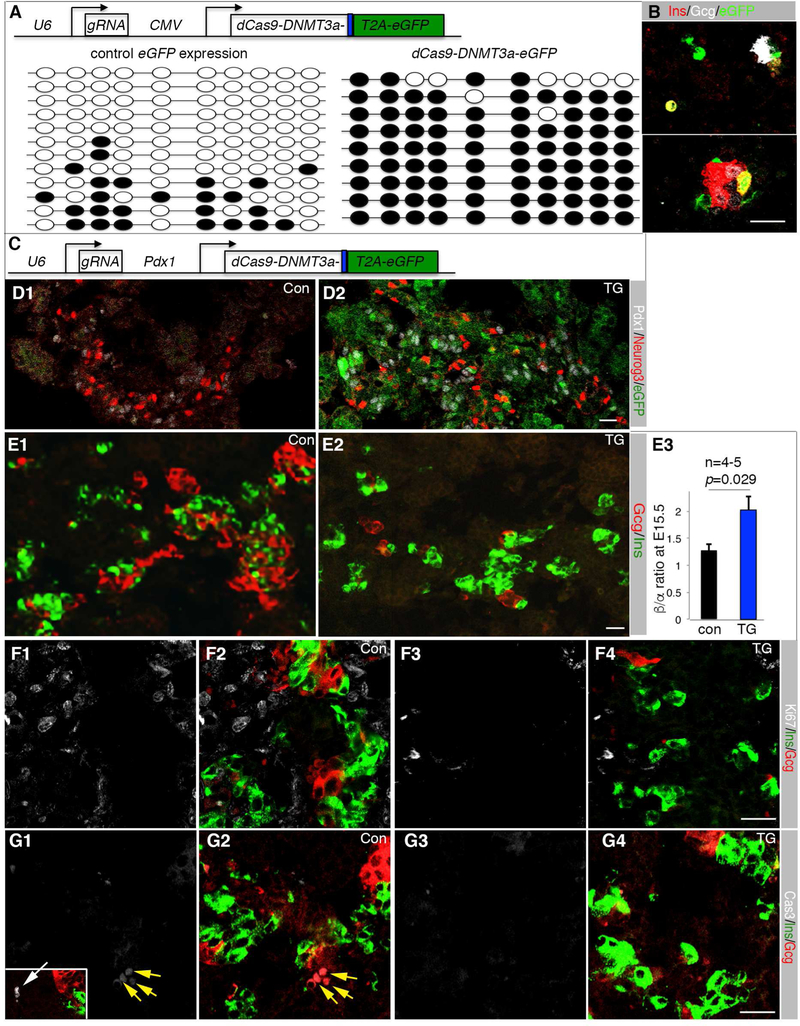
Figure 6. UR2 hyper-methylation promotes β-cell production.
(A) The top depicts the DNA construct electroporated into E12.5 pancreatic cells. eGFP+ cells were sorted after three-day hang-drop culture and used for UR2 methylation assays (bottom). Dark circles indicated methylated CpG dinucleotide. (B) Ins/Gcg expression status of electroporated pancreatic cells 4-days after hang-drop culture. (C) The DNA construct used for transgenic (TG) mouse derivation. dCas9 and the DNMT3a activation domain were produced as a fusion protein. eGFP was produced as a separate protein via a T2A peptide. (D) Neurog3 and eGFP expression in E15.5 control (con) and TG pancreatic sections. (E) Ins/Gcg staining and quantification. The p-value in C3 is from t-Test. Error bars in E3 represent SEM. (F) Ki67 detection in E15.5 Ins+ or Gcg+ cells. F1 and F2, control sections. F3 and F4, TG sections. Note that single Ki67 (F1, F3) and merged Ki67, Ins, Gcg channels (F2, F4) were shown. (G) Same as F, except activated Cas3 was assayed. Inset in G1 is a Cas3+ cell (white arrow). Scale bars in all panels, 20 μm. Also see Table S3.

