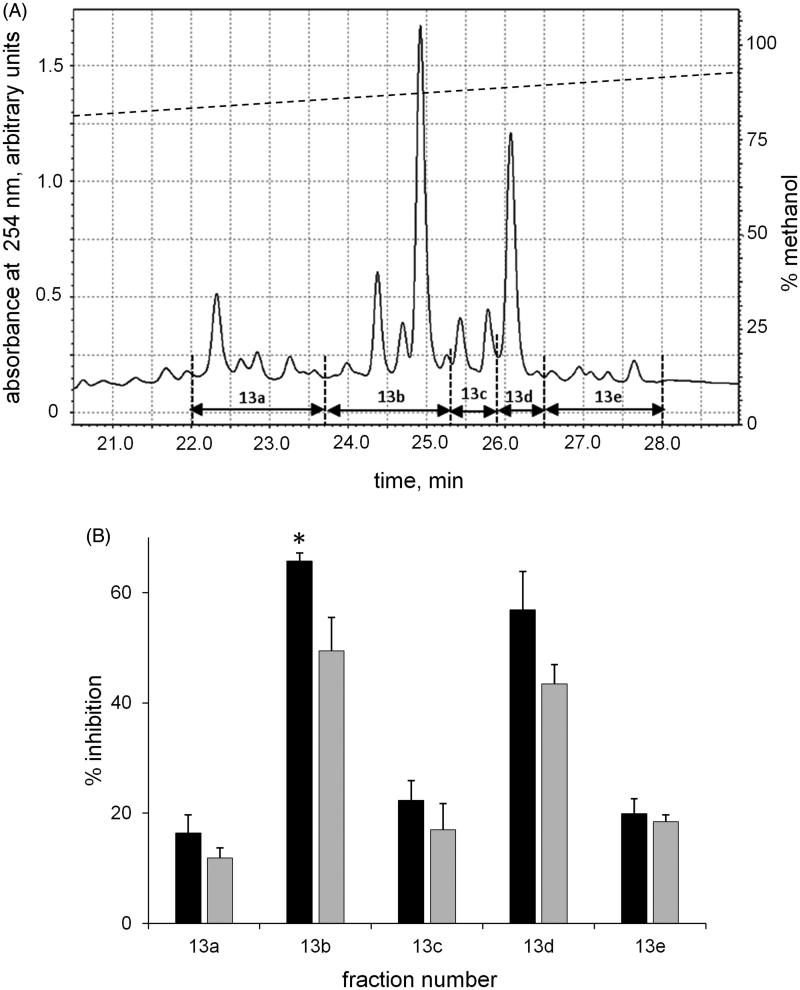
Figure 2.
Chromatographic fractionation of F13. The column eluate with tR from 24–26 min (Figure 1, F13) from three different runs was pooled, dried, resuspended in 0.5 ml of 55% methanol in 0.6% v/v aqueous solution of acetic acid and subjected to chromatographic separation in the conditions described in the Materials and Methods. Panel A: reports the elution profile at 254 nm and the manually collected eluting fractions (namely 13 a–13 e). Panel B: the inhibitory ability of the collected fractions on the hAKR1B1 catalysed reduction of l-idose (black bars) and HNE (gray bars). Error bars (when not visible are within the symbol size) represent the standard deviations of the mean from at least three independent measurements. The statistical significance of differential inhibition % on l-idose reduction with respect to HNE reduction is reported as: *p < 0.05.

