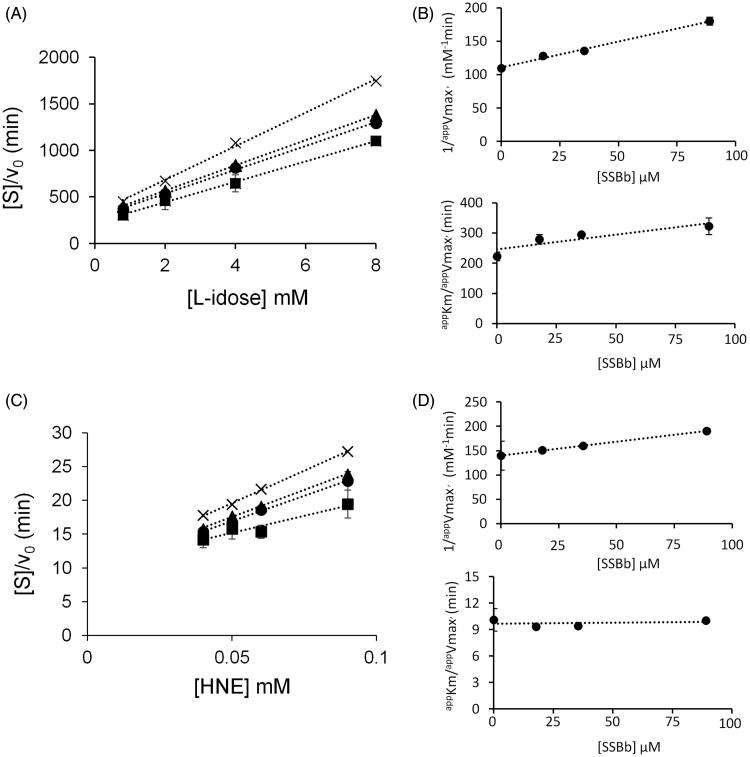
Figure 8.
Kinetic characterisation of SSBb as hAKR1B1 inhibitor. Panel A and Panel C are the Hanes–Woolf plots obtained when the activity of the purified enzyme (8 mU) was measured at the indicated concentrations of the substrate, in the absence (■) or in the presence of the following inhibitor concentrations: (●) 17.8 µM, (▴) 35.5 µM, (×) 89 µM. Panel B and Panel D refer to the secondary plots of the slopes (1/appVmax) and the ordinate intercept (appKM/appVmax) of the relative Hanes–Woolf plot, as a function of the inhibitor concentration. Panel A and Panel B refer to l-idose; Panel C and Panel D refer to HNE. Error bars (when not visible are within the symbols size) represent the standard deviations of the mean from at least three independent measurements.

