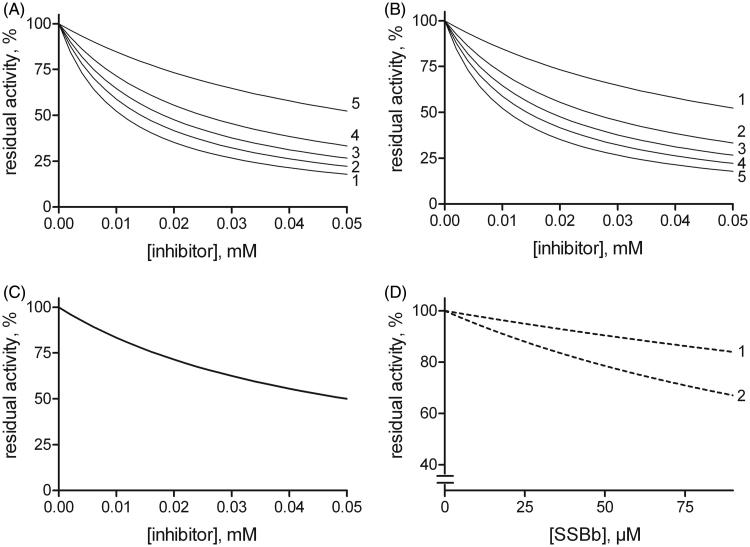
Figure 9.
Effect of the substrate concentration on the susceptibility to inhibition for different inhibition models. Reaction rates (residual activity %) versus the inhibitor concentration at different fixed substrate levels were generated by computer-assisted simulation using a kinetic equation (see text, Equation (1) describing a general mixed inhibition model. Panels A, B and C: once a KM value of 1 mM had been arbitrarily fixed, the plots were generated for mixed type inhibitors exhibiting, Ki (0.01 mM) ten-fold lower than K’i (0.1 mM) (Panel A), Ki (0.1 mM) ten-fold higher than K’i (0.01 mM) (Panel B) or Ki (0.05 mM) equal to K’i (Panel C). Curves 1–5 refer to fixed mM substrate concentrations of 0.01, 0.05, 1, 2, and 10, respectively. In Panel C the curves overlap. Panel D: A computer-assisted plot was generated to simulate the effect of SSBb making use of the inhibition constants on the activity of hAKR1B1 reported in Table 2 for HNE reduction (curve 1) and l-idose reduction (curve 2). The concentration of each substrate was fixed at a value which is the same one as adopted in Figure 6.

