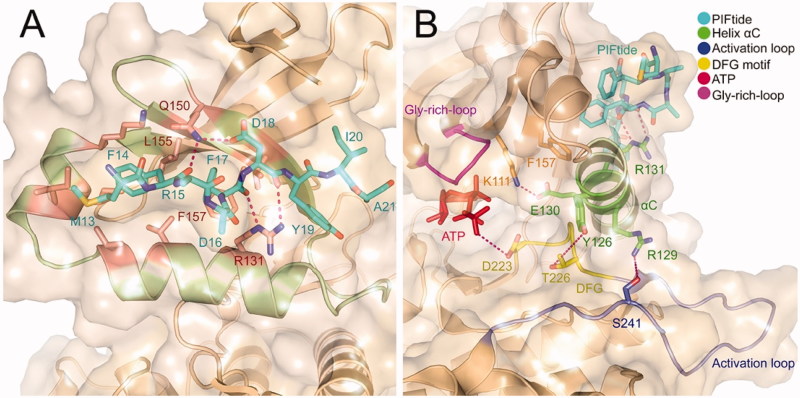
Figure 2.
(A) Ribbon representation of the X-ray structure of PDK1-PIFtide complex (PDB ID: 4RRV). The residues that form the PIF-pocket are shown in salmon, while the other residues from PIFtide are shown in cyan. (B) Ribbon representation of the connection of the helix αC with the activation loop, DFG, and Gly-rich-loop. The helix αC and related residues are shown in green, DFG and related residues are shown in yellow, activation loop and related residues are shown in slate, and Gly-rich-loop is shown in magenta.

