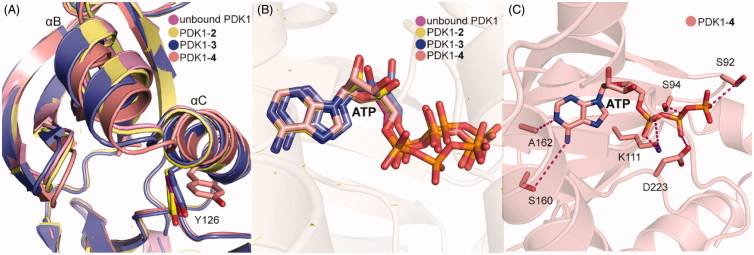
Figure 10.
(A) Comparison of the helix αB and helix αC of unbound PDK1 (magenta), PDK1-2 complex (pale yellow), PDK1-3 complex (slate), PDK1-4 complex (salmon). (B) Comparison of the ATP of unbound PDK1 (magenta), PDK1-2 complex (pale yellow), PDK1-3 complex (slate), PDK1-4 complex (salmon). (C) Cartoon/surface representations of the interaction between ATP with the ATP binding site of PDK1-4 complex.

