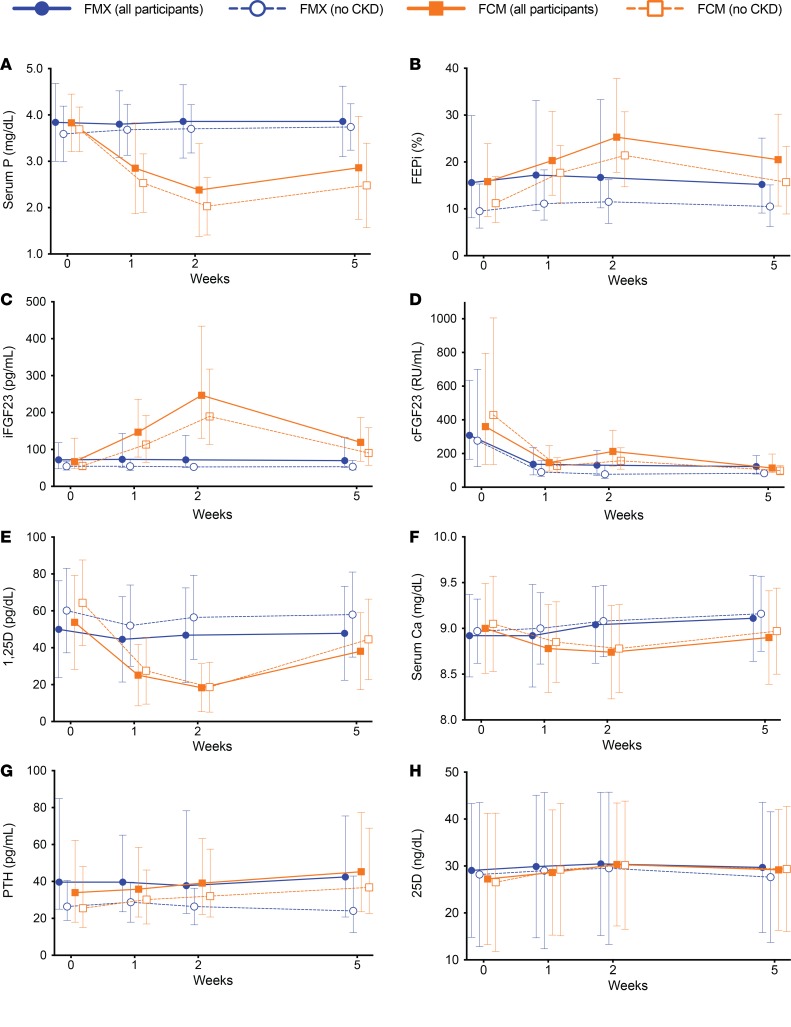
Figure 3. Phosphate homeostatic parameters in the nested physiological substudy.
Changes over time in all patients in the ferumoxytol (FER; n = 87) and ferric carboxymaltose (FCM; n = 98) treatment groups (solid lines) and in the subgroups of patients without chronic kidney disease (CKD; FER, n = 49; FCM, n = 63; dashed lines) in levels of (A) mean serum phosphate (P); (B) median fractional excretion of phosphate (FEPi); (C) median intact fibroblast growth factor 23 (iFGF23); (D) median C-terminal fibroblast growth factor 23 (cFGF23); (E) mean 1,25-dihydroxyvitamin D (1,25D); (F) mean serum calcium (Ca); (G) median parathyroid hormone (PTH); and (H) mean 25-hydroxyvitamin D (25D). Error bars are standard deviations (SDs) for means, and interquartile ranges (25th–75th percentiles) for medians. Intravenous iron was administered at baseline (week 0) and at week 1 after blood and urine were collected.

