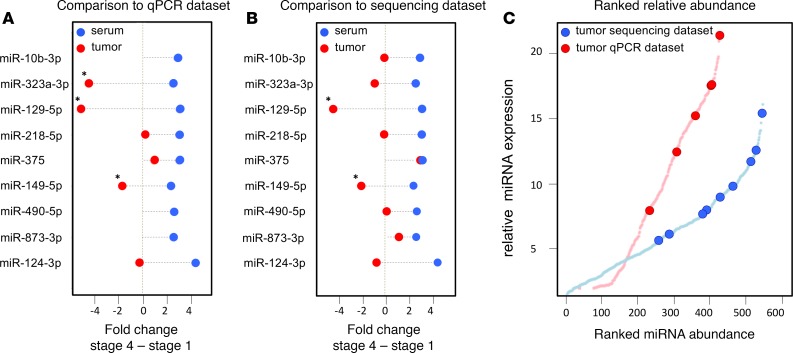
Figure 5. Serum markers for metastatic disease are highly but not differentially expressed in primary tumors.
(A) miRNA abundance differences in serum and in tumor tissue measured by stem-loop qPCR. (B) miRNA abundance differences in serum and in tumor tissue measured by small RNA sequencing. The serum markers for metastatic disease that are differentially expressed between stage 4 and stage 1 tumor are marked by asterisk (Mann–Whitney U test P < 0.05, Benjamini-Hochberg correction for multiple-testing); red dots represent fold changes in tumor tissue, and blue dots represent fold changes in serum. (C) Ranked miRNA abundance in the qPCR data (red) and in the small RNA sequencing data (blue).

