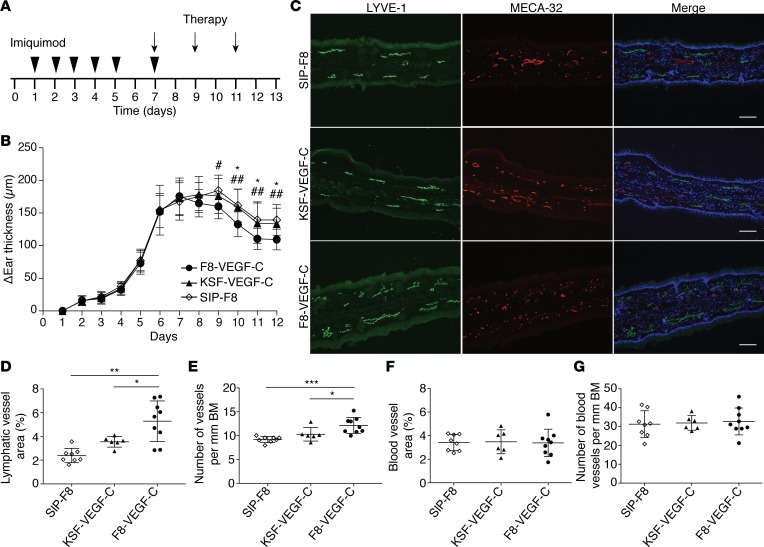
Figure 4. F8-VEGF-C but not KSF-VEGF-C causes lymphatic expansion and accelerates edema resolution in imiquimod-induced inflammation.
(A) Schematic of inflammation study time course and treatment schedule. (B) Ear thickness represented as change compared with ear thickness on day 1 (n = 9 animals per group, 2-way ANOVA with Bonferroni post test; P values noted by an asterisk show comparisons between F8-VEGF-C and KSF-VEGF-C and those noted by pound signs show comparisons between F8-VEGF-C and SIP-F8). (C) Immunofluorescence images of ears from mice that received SIP-F8, KSF-VEGF-C, or F8-VEGF-C stained for LYVE-1 (green), MECA-32 (red), and DAPI (blue). Scale bar: 100 μm. (D) Quantification of lymphatic vessel area (expressed as percentage of analyzed area, n = 6–9 animals per group, 1-way ANOVA with Games-Howell post test). (E) Number of lymphatic vessels in inflamed ears of mice that received the indicated treatment (normalized to basement membrane length, n = 6–9 animals per group, 1-way ANOVA with Bonferroni post test). (F) Quantification of blood vessel area in inflamed ears of mice that received the indicated treatment (expressed as percentage of analyzed area, n = 6–9 animals per group, 1-way ANOVA with Bonferroni post test). (G) Number of blood vessels in inflamed ears (normalized to basement membrane, n = 6–9 animals per group). Data represent mean ± SD. BM, basement membrane. *P < 0.05, **P < 0.01, ***P < 0.001.

