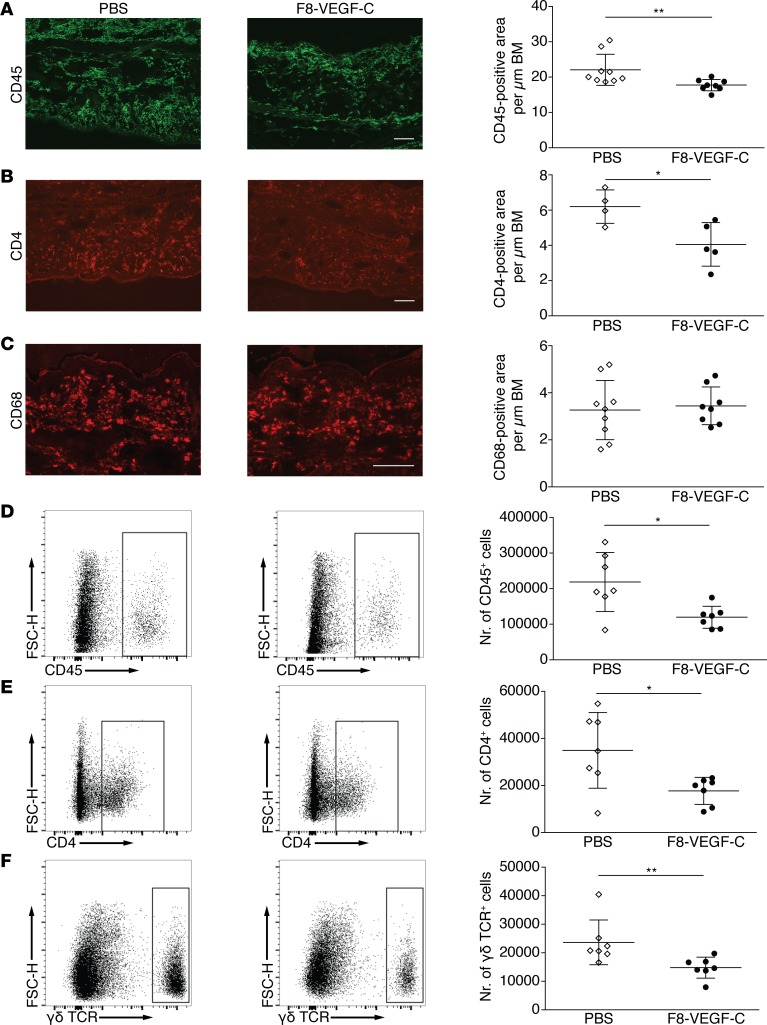
Figure 6. F8-VEGF-C reduces inflammatory cell infiltration in inflamed ears.
(A) Immunofluorescence images of inflamed ears of mice that received PBS or F8-VEGF-C stained for CD45 and quantification thereof (n = 8–9 animals per group, Mann-Whitney test). (B) Immunofluorescence images of inflamed ears of mice that received PBS or F8-VEGF-C stained for CD4 and quantification thereof (n = 4–5 animals per group, 2-tailed Student’s t test). (C) Immunofluorescence images of inflamed ears of mice that received PBS or F8-VEGF-C stained for CD68 and quantification thereof (n = 8–9 animals per group). (D) Representative flow cytometry plots of live cells in inflamed ears of mice that received PBS (left) or F8-VEGF-C (right) and quantification of absolute numbers of CD45+ cells (n = 7 animals per group, 2-tailed Student’s t test with Welch’s correction). (E) Representative flow cytometry plots of live cells pregated for CD45 positivity in inflamed ears of mice that received PBS (left) or F8-VEGF-C (right) and quantification of absolute numbers of live CD45/CD4 double-positive cells (n = 7 animals per group, 2-tailed Student’s t test with Welch’s correction). (F) Representative flow cytometry plots of live cells pregated for CD45 positivity in inflamed ears of mice that received PBS (left) or F8-VEGF-C (right) and quantification of absolute numbers of live CD45/γδ T cell receptor double-positive cells (n = 7 animals per group, Mann-Whitney test). One of two similar experiments shown. Data represent mean ± SD. Scale bar: 100 μm. *P < 0.05, **P < 0.01.

