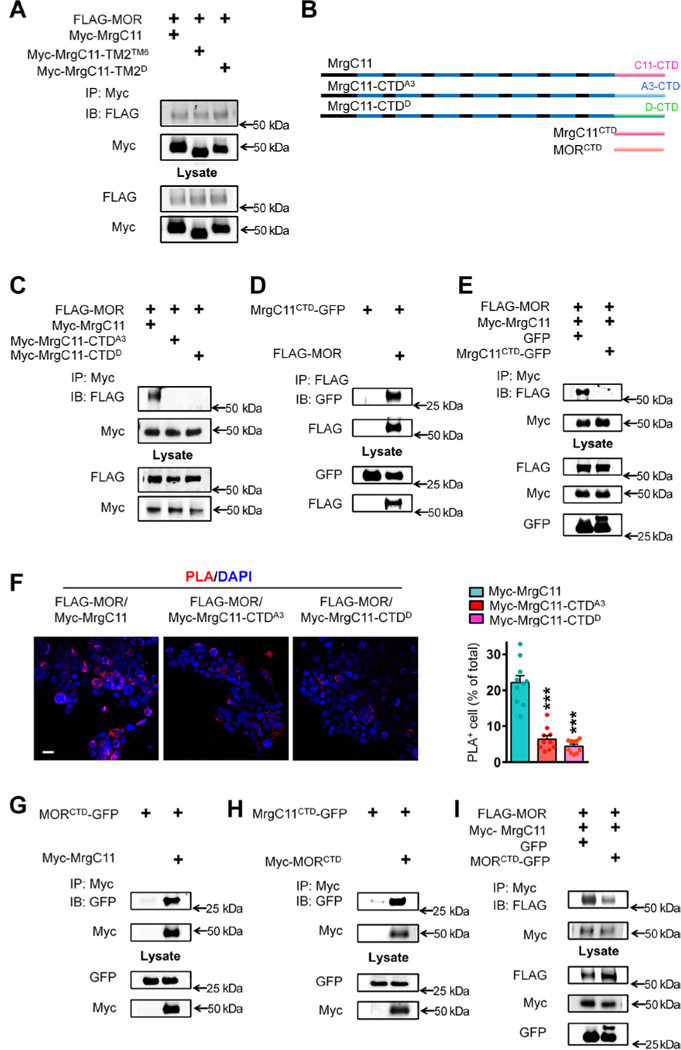
Fig. 2. MrgC11 interacts with MOR through the CTD.

(A) Co-IP to examine the interaction between FLAG-MOR and WT Myc-MrgC11 or two mutant MrgC11s in HEK293T cells. In two mutant MrgC11s, the second TM2 region was swapped with TM6 of MrgC11 (Myc-MrgC11-TM2TM6) or TM2 of MrgD (Myc-MrgC11-TM2D). (B) The diagram shows WT MrgC11; mutant MrgC11s in which the CTD was substituted with that of MrgA3 (MrgC11-CTDA3) or MrgD (MrgC11-CTDD); MrgC11 CTD (MrgC11 CTD); and MOR CTD (MORCTD). (C) Co-IP to examine the interaction between FLAG-MOR and WT Myc-MrgC11, MrgC11-CTDA3, and MrgC11-CTDD mutants in transfected cells. (D) Co-IP to examine the interaction between FLAG-MOR and CTD of MrgC11 (MrgC11CTD-GFP). (E) Co-IP to examine MrgC11-MOR interaction in the presence of MrgC11CID-GFP. (F) Left: PLA of HEK293T cells cotransfected with FLAG-MOR and WT Myc-MrgC11, mutant MrgC11-CTDA3, or MrgC11-CTDD. Scale bar, 20 μm. Right: Quantification of PLA signal (n = 10 experiments per group). (G and H) Co-IP to examine the interaction between MORCTD-GFP and WT Myc-MrgC11 (G) and between Myc-MORCTD and MrgC11CTD-GFP (H). (I) Co-IP to examine whether expression of MORctd-GFP reduces MOR and MrgC11 interaction. (F) ***P < 0.001 versus Myc-MrgC11 by one-way analysis of variance (ANOVA) and Bonferroni post hoc test. Values are mean ± SEM. Data in (A), (C) to (E), and (G) to (I) are representative of three to four experiments.
