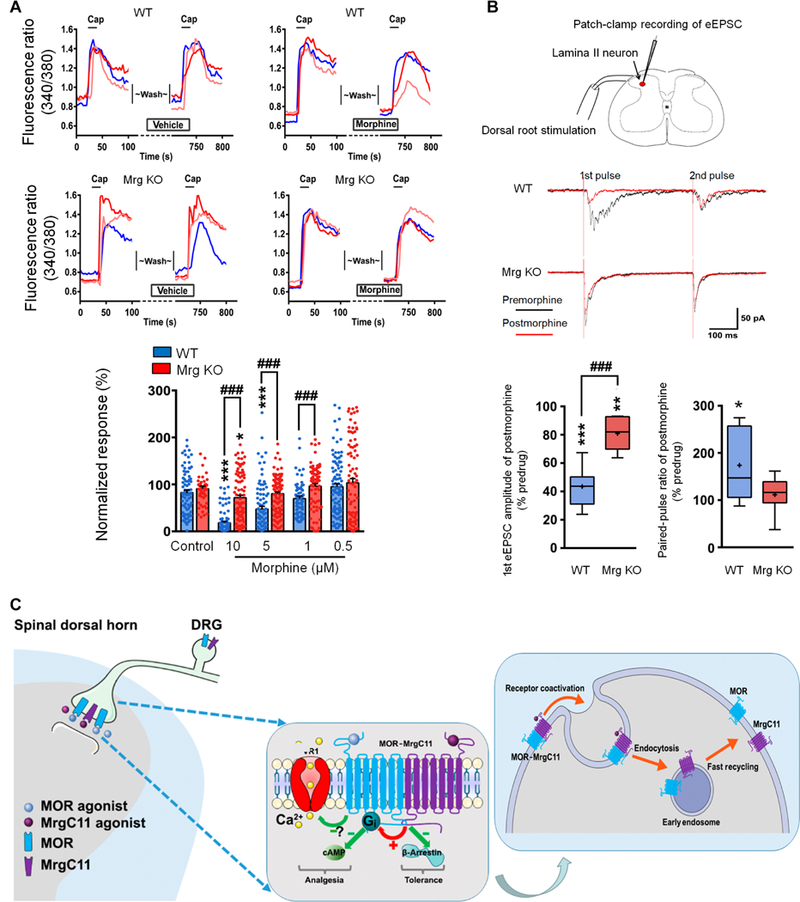
Fig. 8. Hypothetical model illustrating MrgC11 regulation of MOR activity.

(A) Representative traces and quantification show morphine (5 μM) inhibition of capsaicin (Cap; 0.3 μM)–induced [Ca2+]i increase in WT and Mrg KO DRG neurons (n = 54 to 117). Values are mean ± SEM. *P < 0.05 and ***P < 0.001 versus control; ###P < 0.001 by two-way mixed model ANOVA with Bonferroni post hoc test. (B) Top: Patch-clamp recording in a lamina II neuron and representative traces of eEPSCs to paired-pulse test stimulation (500 μA, 0.1 ms, 400-ms interval) before and 5 min after morphine (1 μM). Bottom: Quantification of morphine inhibition of eEPSCs and changes in pairedpulse ratio (n = 8 per group). Box-and-whisker plots show median (horizontal line), mean (+), interquartile range (box), and maximum and minimum values (whiskers). *P < 0.05, **P < 0.01, and ***P < 0.001 versus predrug; ###P < 0.001 by Mann-Whitney U test. (C) Hypothetical model by which MrgC11 regulates MOR activity. Left: Coactivation of MrgC11 and MOR facilitates Gi-coupled regulation of cAMP and shifts the MOR response to agonist away from β-arrestin-2 signaling pathways that mediate morphine tolerance toward the Gi signaling pathways mediating a therapeutic response. Right: Activation of MrgC11 in the MOR-MrgC11 complex leads to receptor coendocytosis. The internalized receptors are sorted into recycling endosomes.
