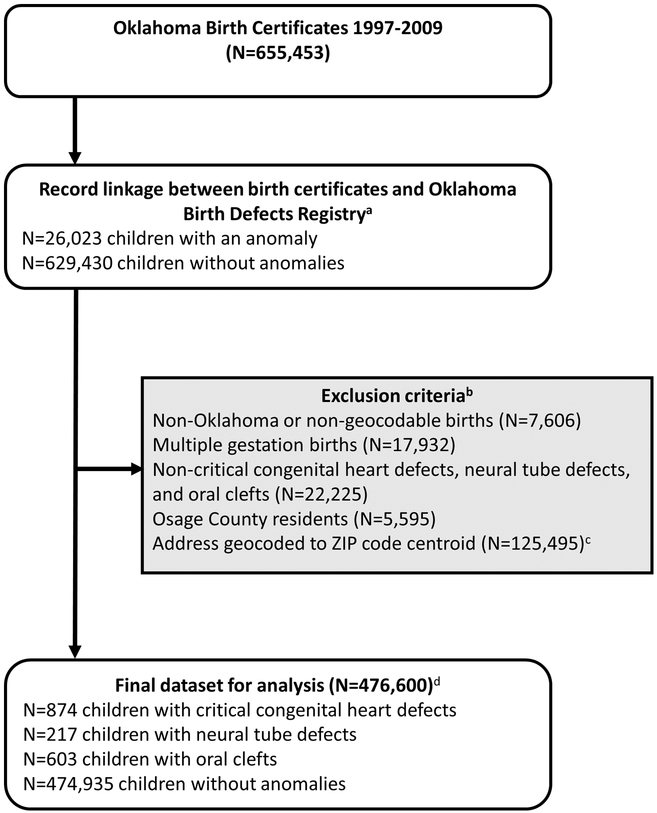
Figure 1.
Flow diagram describing study design and exclusion criteria. Footnotes: a95% of children in the Oklahoma Birth Defects Registry linked with a birth certificate. All birth records without a linked congenital anomaly record were classified as non-congenital anomalies. bExclusion criteria listed in order of exclusion. cWe conducted sensitivity analysis including zipcode level geocodes. d29 children have more than one included congenital anomaly.

