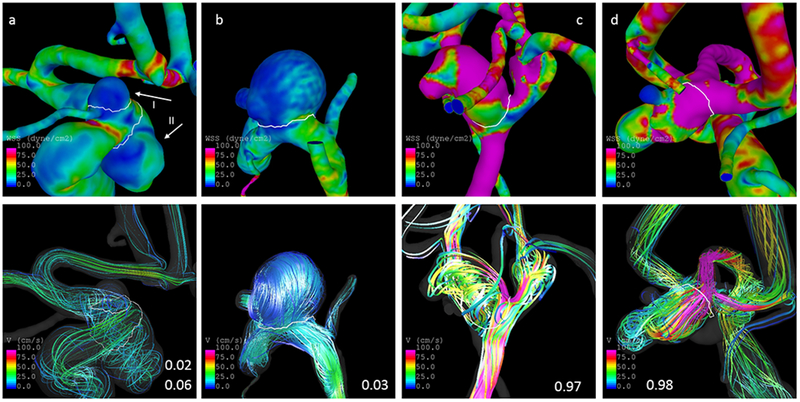
Fig. 5.

Illustration of cases. The panels at the top and bottom show the distribution of WSS and streamlines at half of the cardiac cycle, respectively. The three cases at the left are unruptured aneurysms with a predicted probability for rupture of 0.02 (a-I), 0.06 (a-II), and 0.03 (b). The two cases at the right are ruptured and have predicted probabilities of 0.97 (c) and 0.98 (d). The white lines delineate the aneurysm neck
