
Figure 2. Best responses to GSK2857916 (Part 2; 3∙4 mg/kg dose).
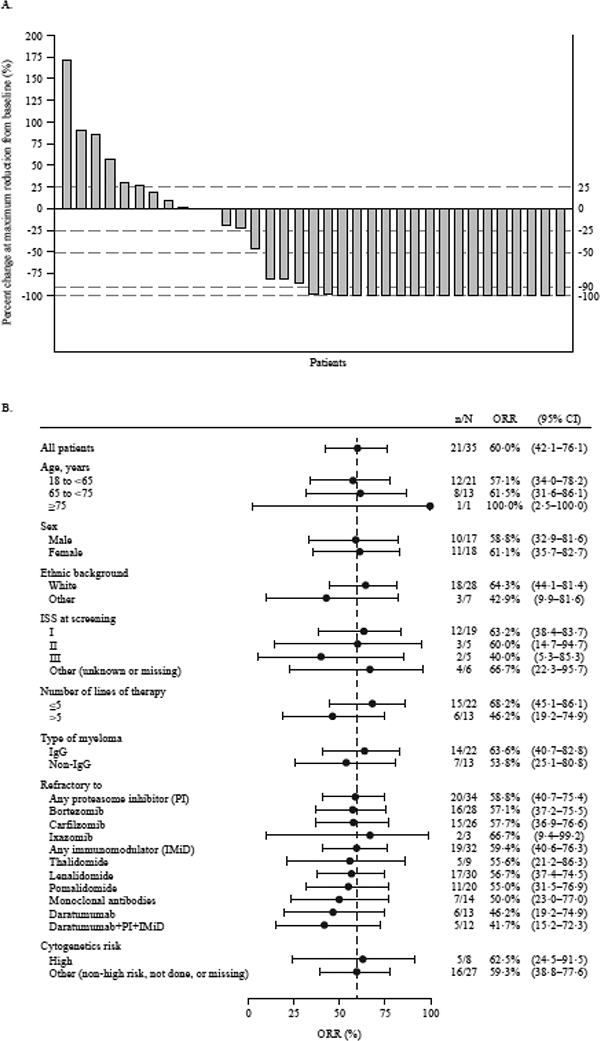
(A) Maximum percentage change of serum/urine M-protein or free light chain as compared with baseline values. For patients with measurable serum M-protein, serum values are depicted; for patients who are followed by urine M-protein, the urine values are depicted; and for patients who did not have measurable serum or urine M-protein and were followed by free light chains, the values for free light chain are depicted. (B) Forest plot of overall response rate by patient subgroup (Part 2). Patients with any of the following genetic abnormalities were considered high risk: t(4:14), del17p, t(14:16).