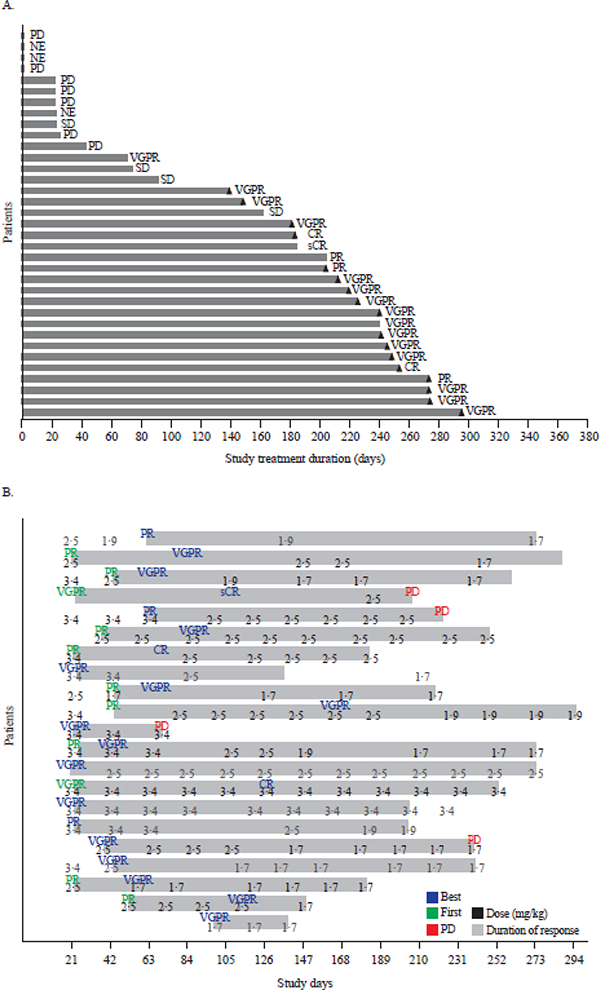
Figure 3. Response durations and effect of dose modifications.

(A) Duration of study treatment by response in Part 2 (3∙4 mg/kg dose). Treatment duration counts the time difference between first dosing date and dosing end date without accounting for dosing interruptions. Triangles indicate ongoing patients. (B) Dose modifications in responding patients in Part 2. For each of the 21 responding patients, indicated in green font is initial response (PR or better); blue font, best response; red font, progressive disease; the numbers indicate dose for each infusion. CR: complete response, MR: minimal response, NE: not evaluable, PD: progressive disease, PR: partial response, sCR: stringent complete response, SD: stable disease, VGPR: very good partial response.
