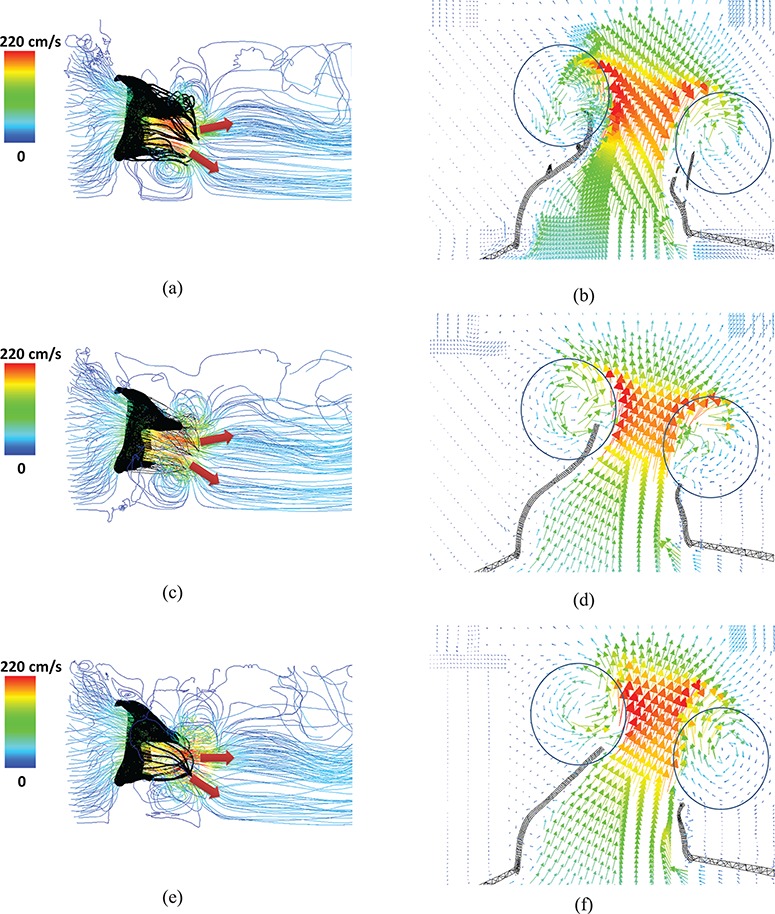
Fig. 12.

Velocity streamlines and vector field of a cross-section, for the complex model (a and b), the pseudo-fibre model (c and d) and the simplified model (e and f). The two jet directions are shown by arrows, and the vortices around the leaflets can be seen in the circled areas. See online version for colours.
