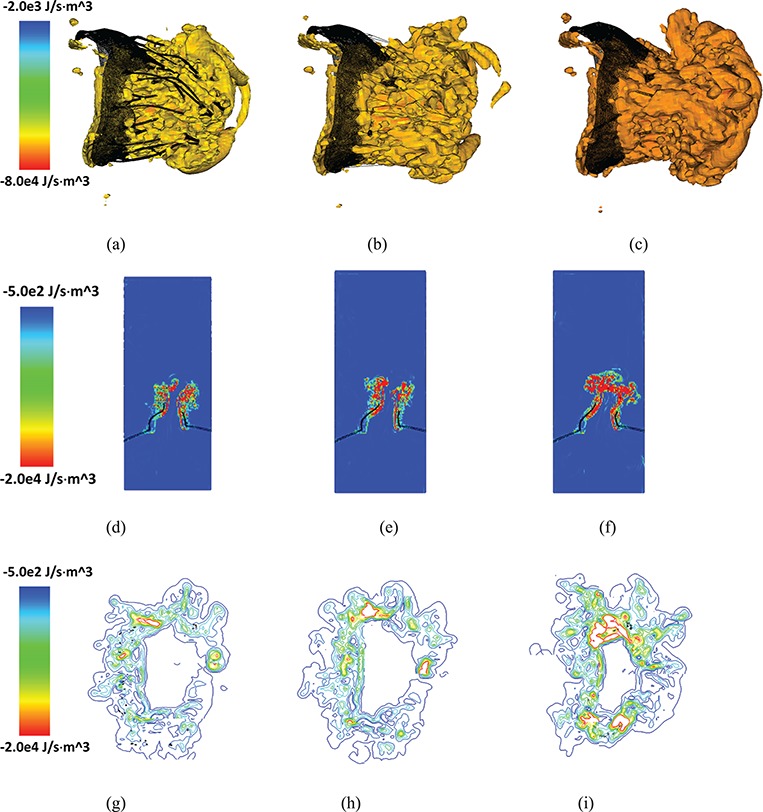
Fig. 16.

Isovolume plots for energy dissipation function ( ) for (a) the complex model, (b) pseudo-fibre model and (c) simplified model. The corresponding 2D sliced views and contour plots around the chordal cross-sections of
  are shown in (d, e and f) and (g, h and i), respectively. See online version for colours.
