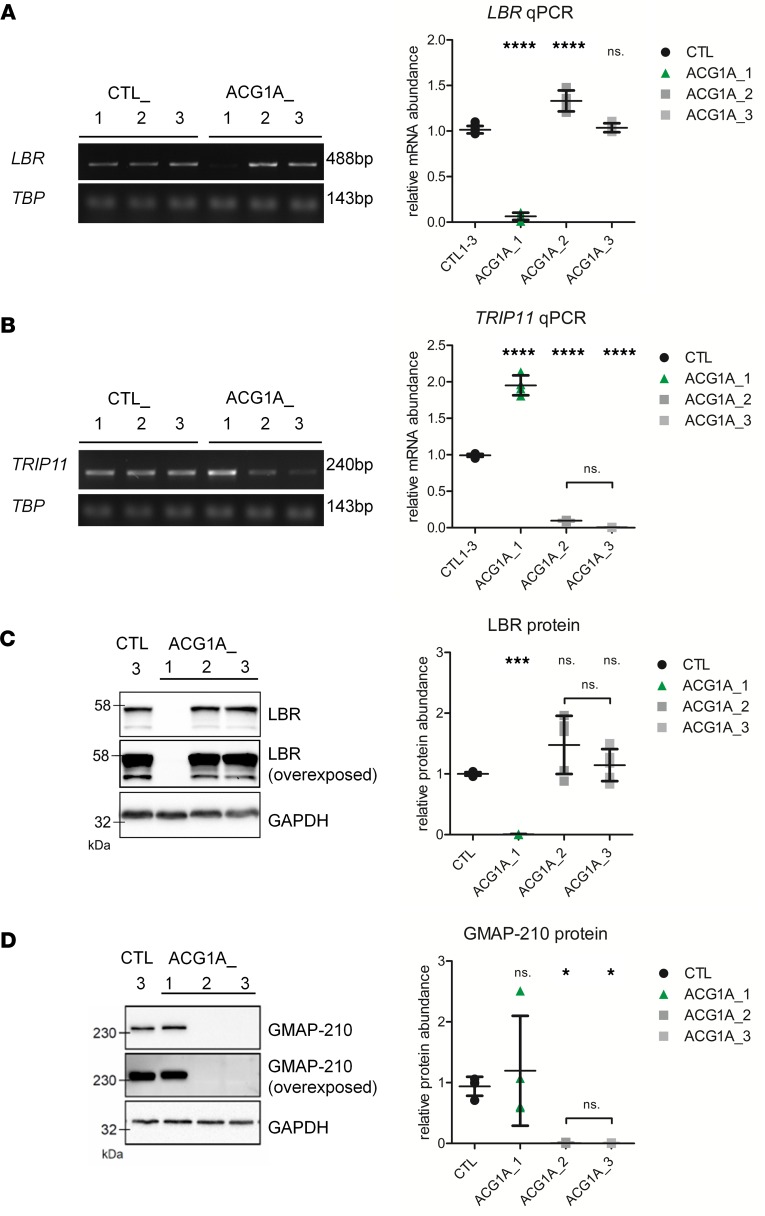
Figure 2. Analysis of LBR and TRIP11 mRNA and protein expression in achondrogenesis 1A (ACG1A) patient–derived primary cells.
Semiquantitative reverse transcription PCR (left, 25 cycles), and quantitative real-time PCR (RT-qPCR) analysis (right) of (A) LBR, and (B) TRIP11 of cDNA derived from patient and control primary fibroblasts. ACG1A_1 carries the homozygous LBR mutation described in this study, ACG1A_2 and 3 bear biallelic mutations of TRIP11; CTL_1 to 3 are matched wild-type controls. TBP was used for normalization; the same agarose gel is shown in A and B, which are representative of 3 independent experiments (N = 3). For RT-qPCR results, the average value of the controls was set to 1 (n = 12). Horizontal lines represent the mean of quadruplicates (n = 4), error bars indicate SD. Statistical differences were assessed by 1-way ANOVA using Bonferroni’s correction for multiple comparisons; ns., not significant. ****P < 0.0001. Immunoblots of (C) LBR and (D) GMAP-210 protein in whole-cell lysates of patients and controls; GAPDH staining indicates total protein loading and was used for normalization in quantitative signal analysis (right). Horizontal lines represent the mean of triplicate quantitative blot signal analyses (n = 3), error bars indicate SD. Statistical differences were assessed by 1-way ANOVA using Bonferroni’s correction for multiple comparisons; ns., not significant. *P ≤ 0.05, ***P < 0.001. See complete unedited blots in the supplemental material.

