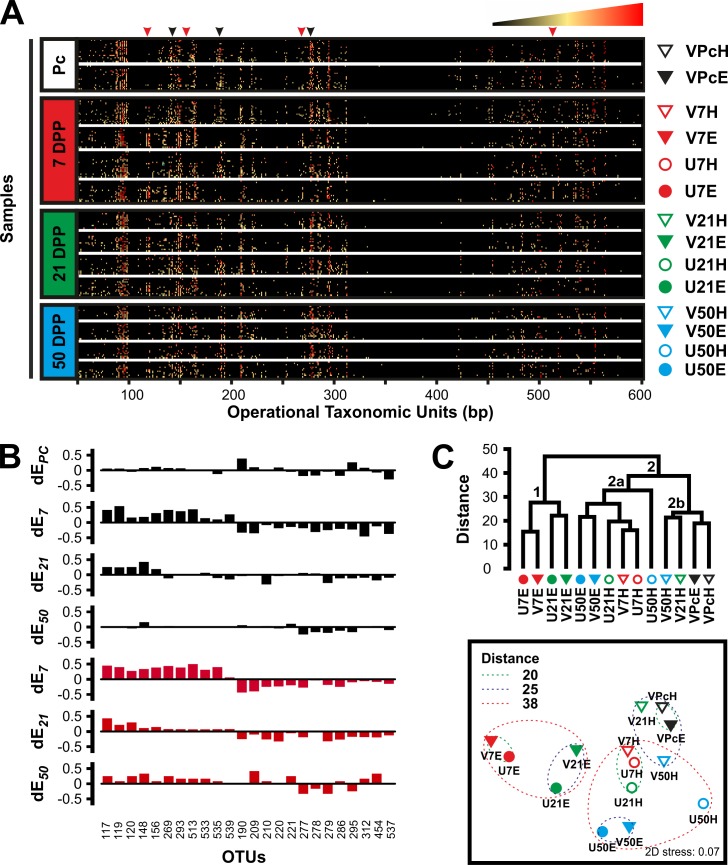
Fig 2. Temporal analysis of the microbiome associated with the reproductive tract of cows pre- and postpartum.
A) T-RFLP-based analysis of the vaginal (triangles at the right of the heatmaps) and uterine (circles) microbiomes of healthy (empty symbols) and endometritic (solid symbols) cows pre-calving (Pc) and at different times postpartum (7, 21 and 50 DPP). The profile of each sample (rows) is populated by OTUs of varying lengths (columns). Arrowheads at the top of the heatmap indicate some of the changes associated with animals developing postpartum endometritis. Black arrowheads, loss of highly represented OTUs; Red arrowheads, appearance of OTUs. The relative abundance of the OTUs in a given profile is indicated by the colour key at the top right corner. Amplicons of the 16S rRNA were obtained from DNA samples by nested PCR and as described in Materials and Methods section. Fluorescently labeled terminal restriction fragments (TRFs) were resolved in an ABI 3730xl genetic analyzer. GeneScan Liz 600 size standard was used for fragment sizing using GeneMapper v4.0. OTUs were assigned in T-Align from TRFs representing at least 0.5% of the total signal and consistently found in duplicated samples. The heat maps were produced in Excel 2010 using the conditional formatting function. B) Differential OTUs in the reproductive tract of dairy cows postpartum. The dEt value accounts for the difference in frequency of a given OTU between groups of cows, that at 21 DPP were diagnosed respectively as endometritic and healthy (dEt = fe−fh), at a given time postpartum (denoted by t). Thus, the frequency of OTUs with positive values of dE is increased in endometritic animals while negative values show increased frequency in healthy cows at a given time postpartum. Top to bottom plots respectively correspond to pre-calving, 7, 21 and 50 DPP in vagina (Black plots) and 7, 21 and 50 DPP in uterus (Red plots). C) Complete linkage hierarchical cluster analysis (Top panel) and non-metric multidimensional scaling (Bottom panel) of groups. Distances are based on Bray-Curtis dissimilarity of group centroids. Each group is identified using the same symbols showed at the right of the heat maps in A. The analysis was performed in PRIMER6 and PERMANOVA+ with group centroids obtained from a resemblance matrix generated from square root transformed T-RFLP data. Table 1 shows the number of samples per group. Figures were re-drawn using CorelDraw X4.

