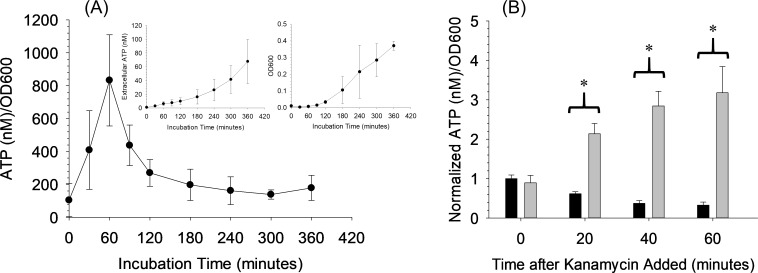
Fig 5. Results for gram-positive B. subtilis.
(A) ATP/OD600 curve for gram-positive B. subtilis. Inlayed graphs show the individual extracellular ATP (left inlayed) and OD600 (right inlayed) curves. The OD600 curve does not contain the background absorbance. n ≤ 3; error = standard deviation. (B) Normalized ATP/OD600 graph showing susceptibility of B. subtilis to a bactericidal antibiotic. B. subtilis was preincubated for 2 hours with the antibiotic chloramphenicol (5 mg/L, black bars), which permits selective growth, before adding the antibiotic to which the bacteria are susceptible, kanamycin (gray bars). Kanamycin (50 mg/L), along with the antibiotic that permits selective growth, was compared against a control containing only the antibiotic that permits selective growth. n = 3; error = standard deviation; * p < 0.05.

