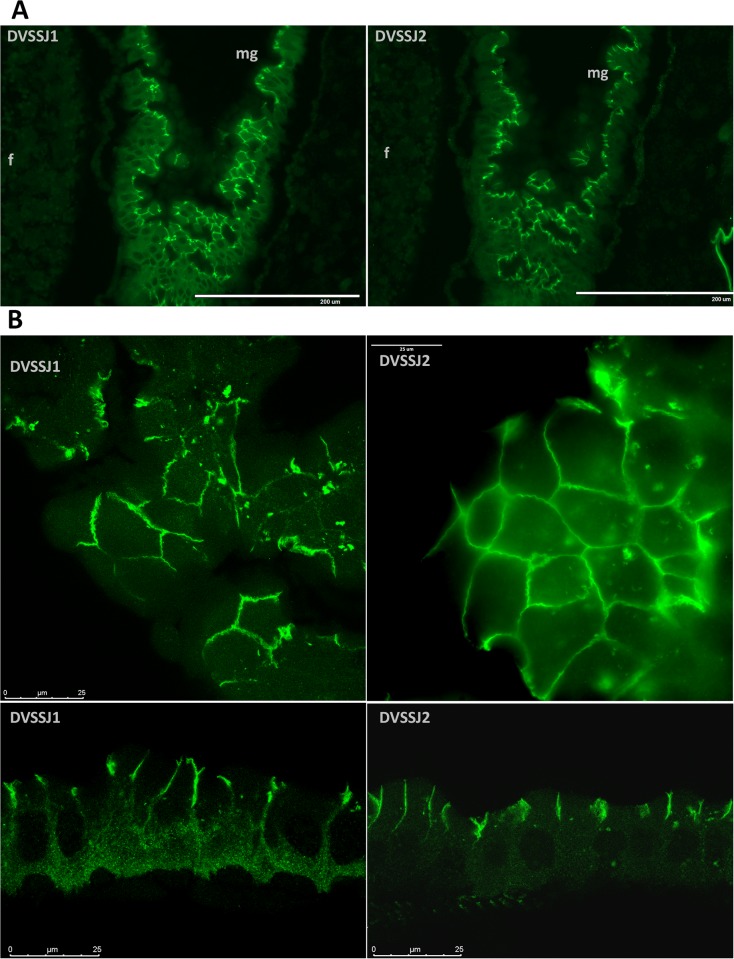
Fig 2. Immunofluorescence microscopic analysis of DVSSJ1 and DVSSJ2 in WCR larvae.
(A) two adjacent sections were selected to compare DVSSJ 1 (left) and DVSSJ2 (right) expression. Images are representative sections (S3 Fig) of midguts (mg) collected from the 3rd instar of WCR larvae and hybridized with antibodies as described in Method. (B) confocal images of selected midgut cells showing DVSSJ1 and DVSSJ2 localization. Scale bar = 200 um (A) and bar = 25 um (B).

