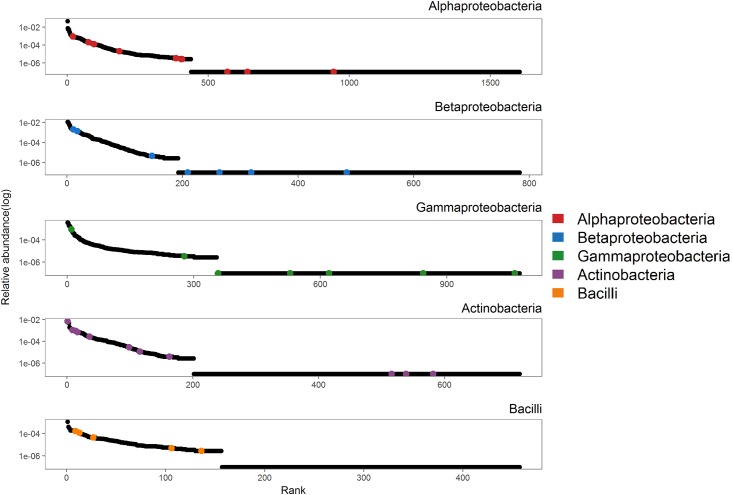
Fig 3. Species abundance distribution of bacterial classes.
Species abundance distributions of the OTUs in the field community belonging to the 5 different classes isolated in this study displayed as log-transformed relative abundance vs. species rank in the community; OTUs that were matched to a bacterial isolate are marked in colour.

