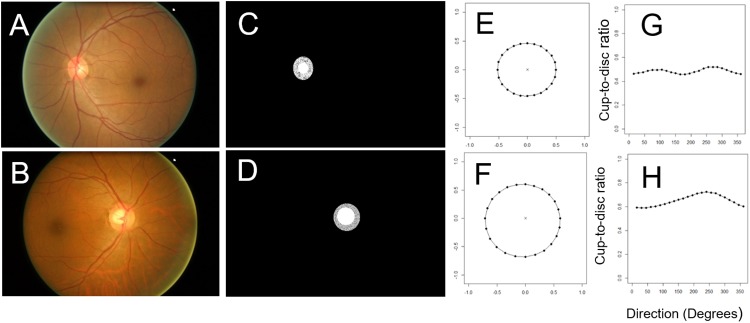
Fig 3. The profile of 24 cup/disc ratios (pCDR) in two eyes.
One healthy fundus (A) and one glaucomatous fundus image (B) are showed here. The cup and disc were semi-automatically segmented, which is shown by the best-fitting ellipses (C and D). The profile of 24 CDR values were plotted in circular (E and F) and Cartesian systems (G and H).

