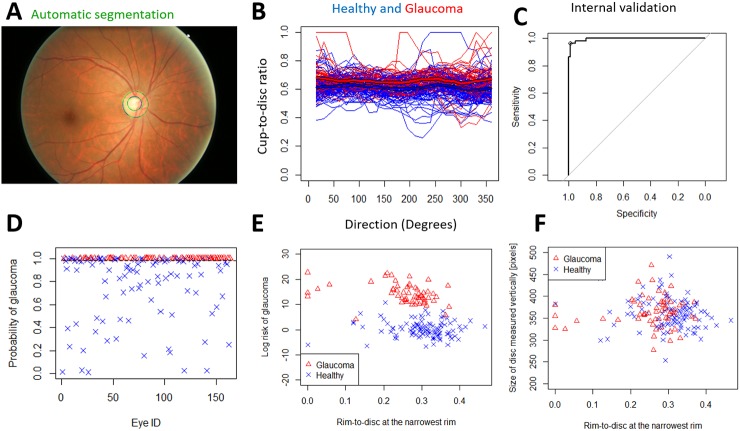
Fig 5. Internal validation of the spatial algorithm using automatically segmented images from ORIGA.
A) The grader's semi-automatic segmentation (blue) and the fully automatic segmentation (green). B) The individual automatically segmented profiles with means (thick blue line for healthy, thick red line for glaucomatous). We used the automatically segmented discs and cups to detect glaucoma. C) The AUROC is 99.6%. D) The probability of glaucoma and the decision threshold for 96.6% sensitivity and 99.0% specificity. The size of the testing dataset is n = 163. E) The risk of glaucoma (log(p/(1 − p))) vs Rim-to-Disc at the narrowest rim. F) The Rim-to-Disc at the narrowest rim vs disc size.

