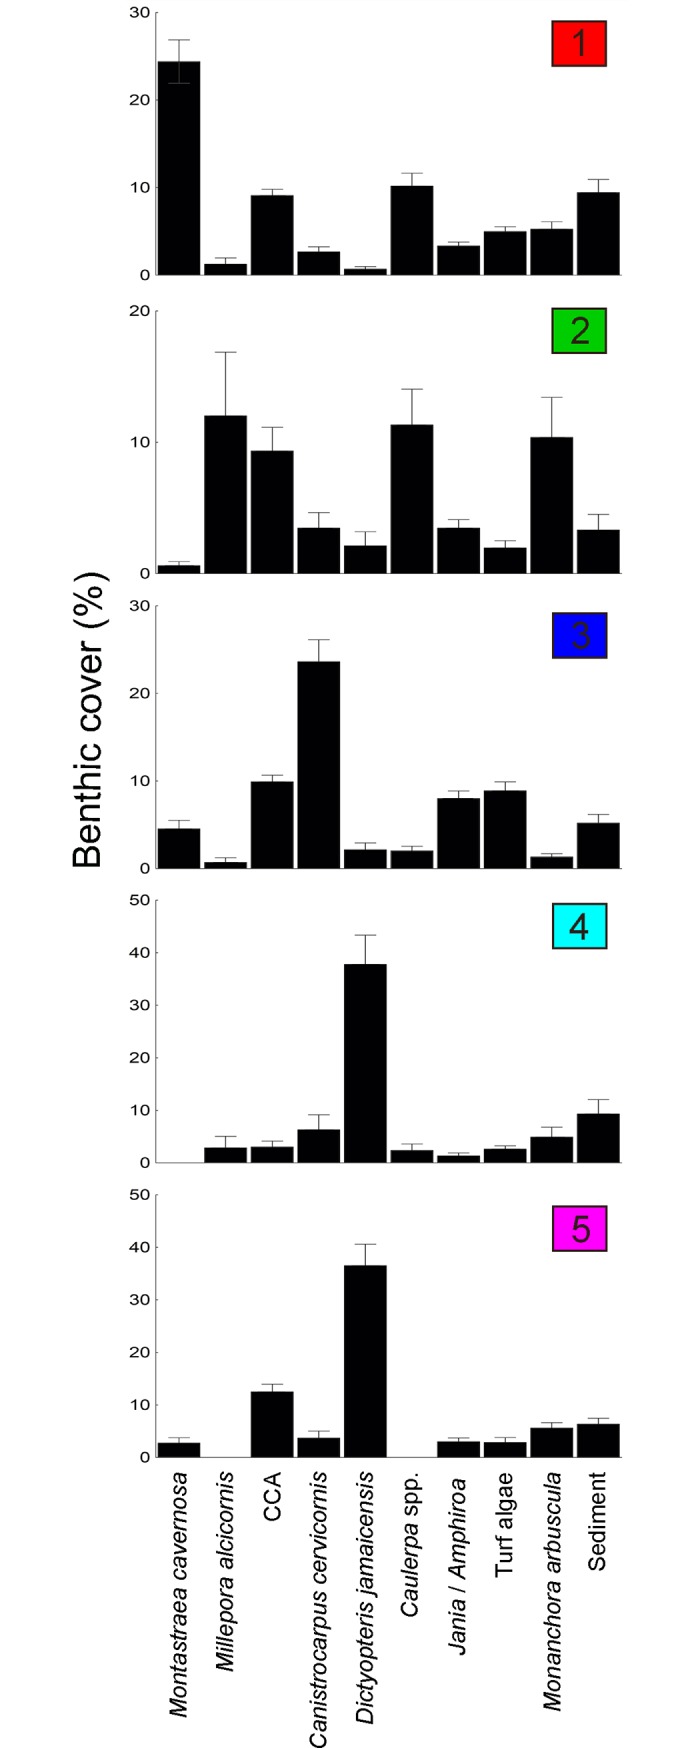
Fig 4. Relative abundance (mean ± SE) of species/functional groups responsible for splits (i.e. differentiation between assemblages) in the MVRT model in the five typical assemblages.

All species/groups representing > 2% of total benthic cover are shown. Colour pattern follows Fig 2. Note differences in scale of y axis.
