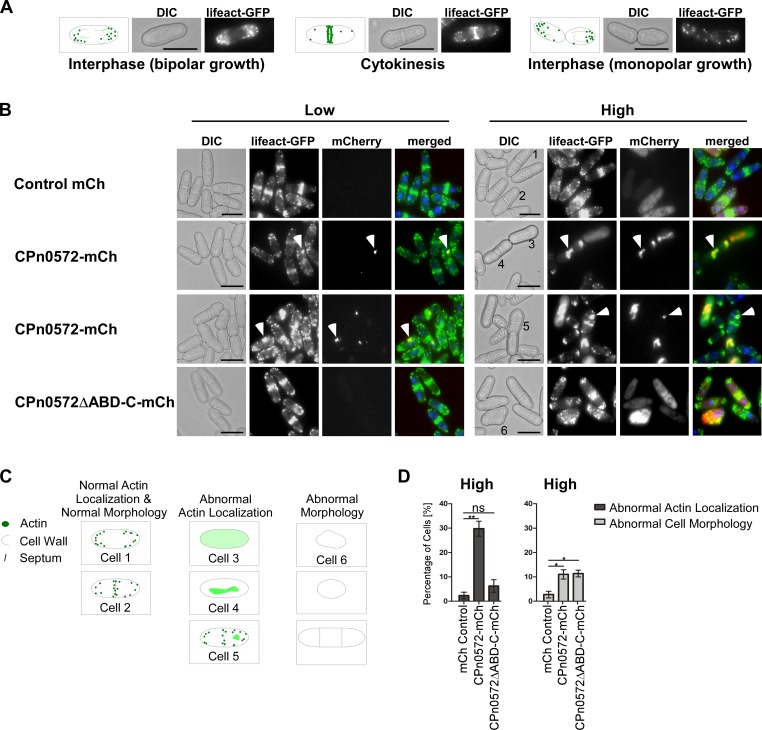
Fig 2. CPn0572 expression influences actin localization and morphology in S. pombe.
(A) Actin localization during the cell cycle. Schematic representation of the Differential Interference Contrast microscopy (DIC) and lifeact-GFP images showing actin patches (green dots) and cables (green lines) localized to one or both cell ends (bipolar and monopolar growth respectively). During cytokinesis actin re-localizes to the cell middle. Bar, 5 μm (B) Live cell images of representative lifeact-GFP-expressing cells (F-actin is green in merged images) expressing the indicated mCherry protein variants (red in merged images). Cells were stained with Hoechst to visualize DNA (blue in merged images). Transformants were grown for 22 h under plasmid selective conditions leading to either low expression (Low) or high expression (High). White arrow heads point to selected aberrant actin structures within cells. Bars, 5 μm. (C) Diagrammatic representation of cells phenotypes used for quantification in D with examples labeled 1–6 shown in 2B (right panels). Normal actin localization and cell shape: Cell 1 (bipolar polarized actin localization) and Cell 2 (cytokinetic localization). Abnormal actin localization: Cell 3 (diffused actin), Cell 4 (aberrant actin structures without regular actin patches) and Cell 5 (aberrant actin structures with regular actin patches). Representative cell displaying aberrant cell morphology as depicted in schematic representation: Cell 6 (swollen cell morphology). (D) Quantification of cells grown under high expression of CPn0572 variants that present abnormal actin localization and abnormal cell morphology similar to the examples shown in B and S1 Fig A. n = 3 samples each representing 40–80 cells. Error bars denote standard error of the mean. Student’s t-test was used to determine statistical significance. p < 0.005 (**), p < 0.05 (*), and not significant (ns).

