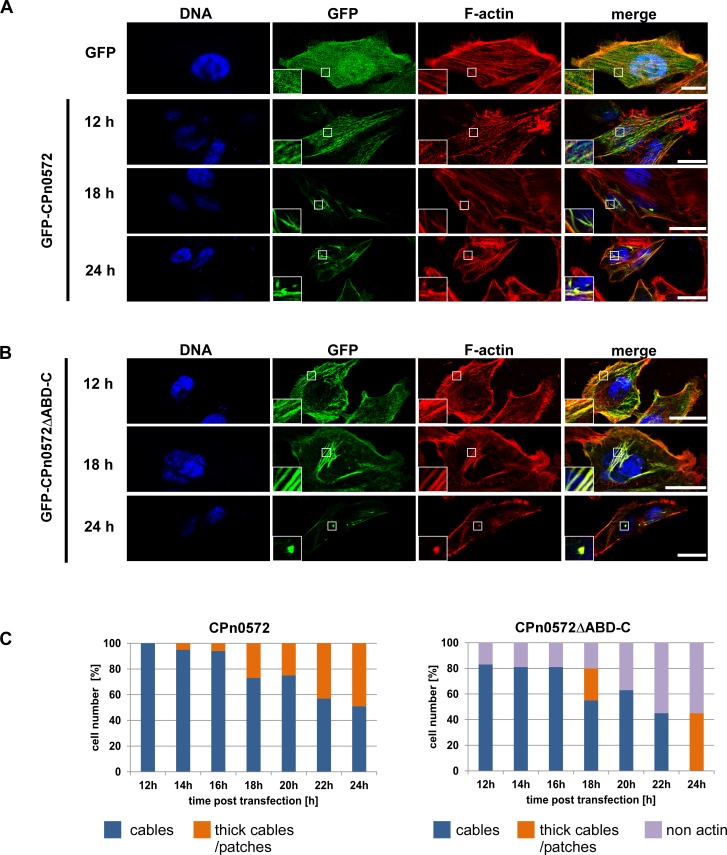
Fig 3. CPn0572ΔABD-C colocalizes with actin in mammalian cells.
Confocal images of cells transfected with plasmids encoding GFP or GFP-CPn0572 (A) or GFP-CPn0572ΔABD-C (B). HEp-2 cells were transfected with indicated plasmids for 12, 18, or 24 h and F-actin was visualized with phalloidin (red) and DNA with DAPI (blue). Scale bar: 10 μm. Boxed regions show 3-fold enlargement. (C) Quantification of GFP-CPn0572 and GFP-CPn0572ΔABD-C-derived phenotypes after transfection, monitored every 2 h (range: 12 to 24 h). n ≥ 100 cells per time point and per transfected plasmid. All quantifications were reproducible and analyzed from triplicates.

