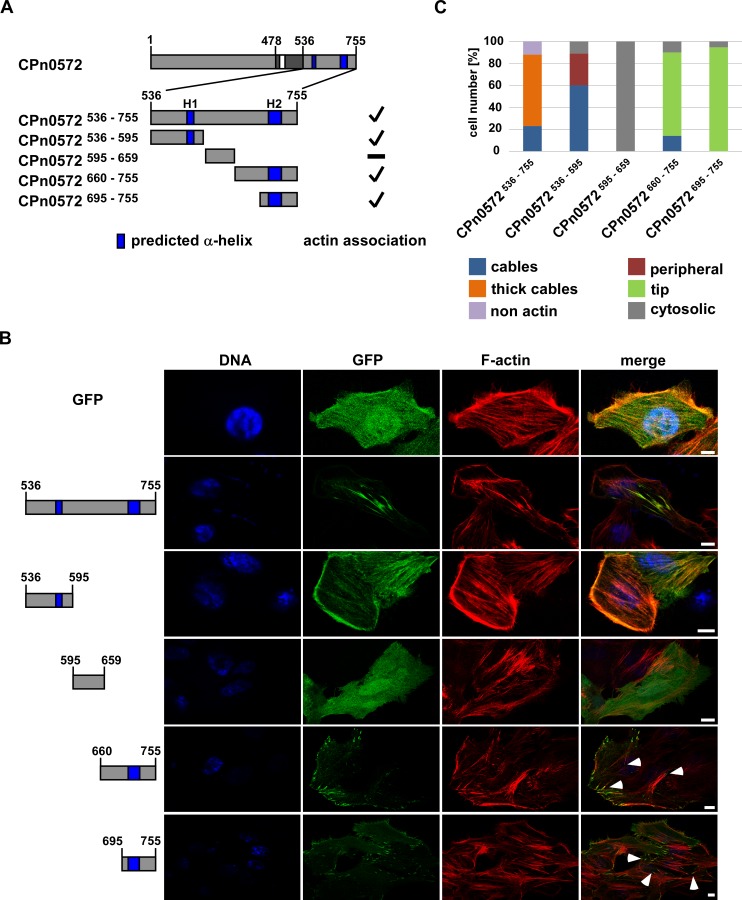
Fig 6. CPn0572536-595 associates with actin.
(A) Schematic representation of CPn0572 and C-terminal variants. ABD-C, black box; ABD, white box; predicted α-helices, dark blue boxes (labeled H1 and H2). Numbers indicate amino acid positions. Positive actin association is indicated by a checkmark and non-actin association with a minus on the right margin of the drawings. (B) Confocal fluorescence microscopy analysis of transfected cells expressing GFP or GFP-CPn0572 variants. HEp-2 cells were transfected for 18 h before fixation. F-actin was visualized with phalloidin (red) and DNA with DAPI (blue). Tips of actin cables are marked by white arrow heads. Bar: 10 μm. (C) Quantification of localization phenotypes of GFP-CPn0572 and variants shown in (B): CPn0572536-755 (n = 572), CPn0572536-595 (n = 313), CPn0572595-659 (n = 380), CPn0572660-755 (n = 347) and CPn0572695-755 (n = 563). All quantifications were reproducible and analyzed from triplicates.

