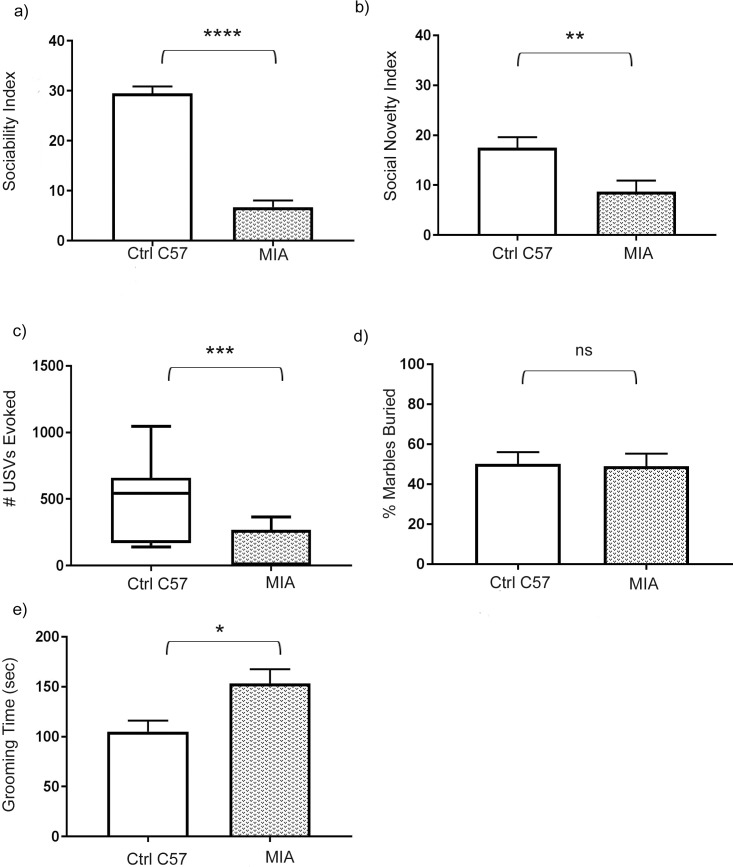
Fig 1. Maternal immune activation mice exhibited impaired social interaction, decreased communication, and repetitive behavior.
(a) Three-chamber test assessment of sociability index, with results shown for maternal immune activation (MIA) mice and control C57BL/6J mice (control mice, n = 24; MIA mice, n = 35). Student’s unpaired t test, p < 0.0001. (b) Three-chamber test assessment of social novelty index, with results shown for MIA and control mice (control mice, n = 24; MIA mice, n = 34). Student’s unpaired t test, p = 0.0077. (c) Ultrasound vocalizations (USVs) were recorded during interactions with the male test mouse in the presence of an unfamiliar female in estrous. The number of USVs recorded in a five-minute period are shown for MIA and control mice. USVs are graphed as box-whisker plots (control mice, n = 7; MIA mice, n = 15). Mann-Whitney test, p < 0.001. (d) Marble burying assessment of MIA and control mice. The percentage of marbles buried at the end of a thirty-minute period is shown (control mice, n = 22; MIA mice, n = 24). Student’s unpaired t test, p = 0.88. (e) Grooming assessment of MIA mice and control mice. The time in seconds spent grooming over a ten-minute period is shown (control mice, n = 15; MIA mice, n = 24). Student’s unpaired t test, p = 0.022. (a, b, d, e): data represented as mean +/- SEM. (c): data represented as box-whisker plot.

