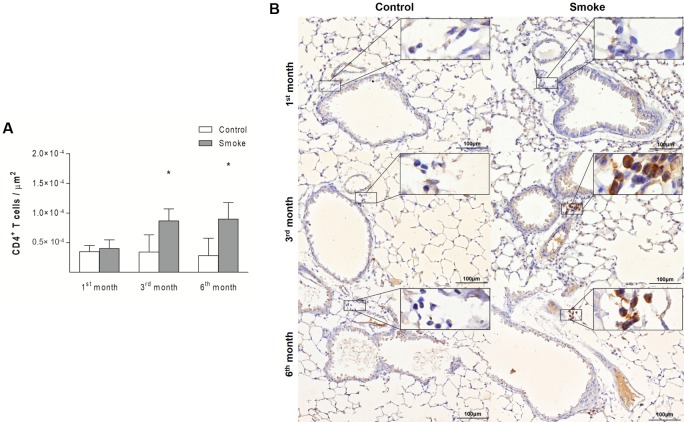
Fig 4. CD4+ T cells in peribronchovascular areas.
The numbers of CD4+ T cells in peribronchovascular areas obtained for the Control groups after 1 (n = 10), 3 (n = 6), and 6 (n = 7) months and the Smoke groups after 1 (n = 9), 3 (n = 5), and 6 (n = 7) months are presented as the means ± SDs. (A) Significant differences were found after 3 (*P = 0.0190, Mann-Whitney test) and 6 (*P = 0.0023, Mann-Whitney test) months. (B) Representative photomicrographs of CD4+ T cells in peribronchovascular areas are shown at 200× magnification, and images at 1000× magnification are shown in each insert.

