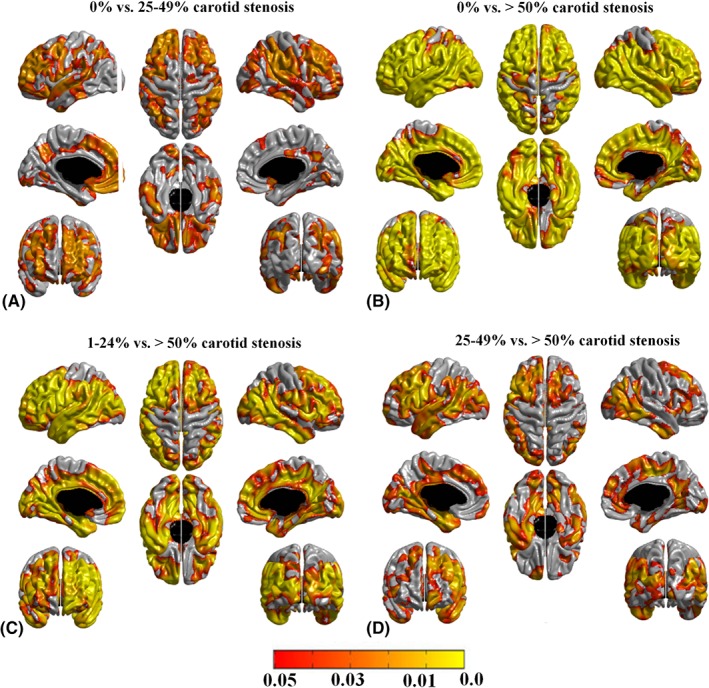
Figure 3.

Pattern of cerebral cortical thinning in (A) individuals with 25–49% carotid stenosis compared to those with no carotid stenosis, (B) individuals with ≥ 50% carotid stenosis compared to those with no carotid stenosis, (C) individuals with ≥ 50% carotid stenosis compared to those with 1–24% carotid stenosis, and (D) individuals with ≥ 50% carotid stenosis compared to those with 25–49% carotid stenosis. Age (in days), gender, vascular risk factors, intelligence quotient at age 11 years, Mini‐Mental State Examination score, and other carotid measures were included as covariates. Areas in orange–yellow shades represent statistically significant cortical thinning at a false discovery rate (FDR) = 0.05. The color bar represents FDR q values. The group contrasts between 0% and 1–24% carotid stenosis and between 1–24% and 25–49% carotid stenosis did not reach statistical significance.
