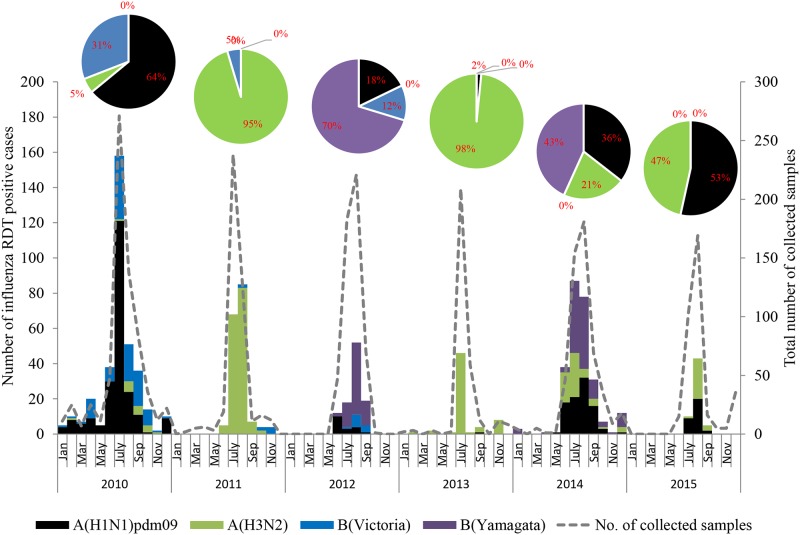
Fig 1. The monthly incidence of influenza A(H1N1)pdm09, A(H3N2), B(Victoria) and B(Yamagata) viruses between 2010 and 2015 in Myanmar.
The number of influenza RDT positive cases is shown as a dashed line. Influenza A(H1N1)pdm09 is shown as black bar; A(H3N2), green bar; B(Victoria), blue bar; B(Yamagata), purple bar. The percentage of influenza A subtypes and B lineages for each year are shown in pie chart.

