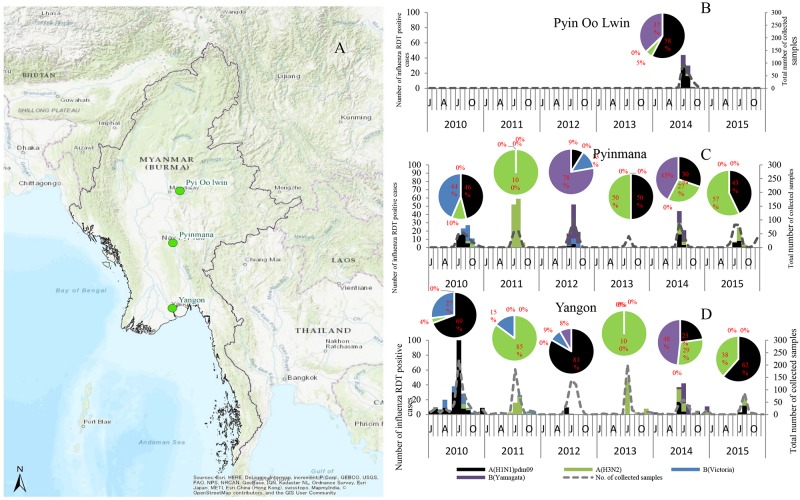
Fig 2. The location of sample collection sites and monthly distribution of influenza isolates according to study sites between 2010 and 2015 in Myanmar.
(A) The map of Myanmar showing three study sites, Yangon, Pyinmana and Pyin Oo Lwin. Monthly distribution of influenza for three locations, (B) Pyin Oo Lwin, (C) Pyinmana and (D) Yangon. The number of influenza RDT positive cases is shown in dashed line. Influenza A(H1N1)pdm09 is shown as black bar; A(H3N2), green bar; B(Victoria), blue bar; B(Yamagata), purple bar. The percentage of influenza A subtype and B lineage in each year is shown in pie chart. This map is designed to be used as a base map by GIS professionals and as a reference map by anyone. The map includes administrative boundaries, cities, water features, physiographic features, parks, landmarks, highways, roads, railways, and airports overlaid on land cover and shaded relief imagery for added context. Sources: Esri, HERE, Garmin, Intermap, increment P Corp., GEBCO, USGS, FAO, NPS, NRCAN, GeoBase, IGN, Kadaster NL, Ordnance Survey, Esri Japan, METI, Esri China (Hong Kong), swisstopo, OpenStreetMap contributors, and the GIS User Community.

