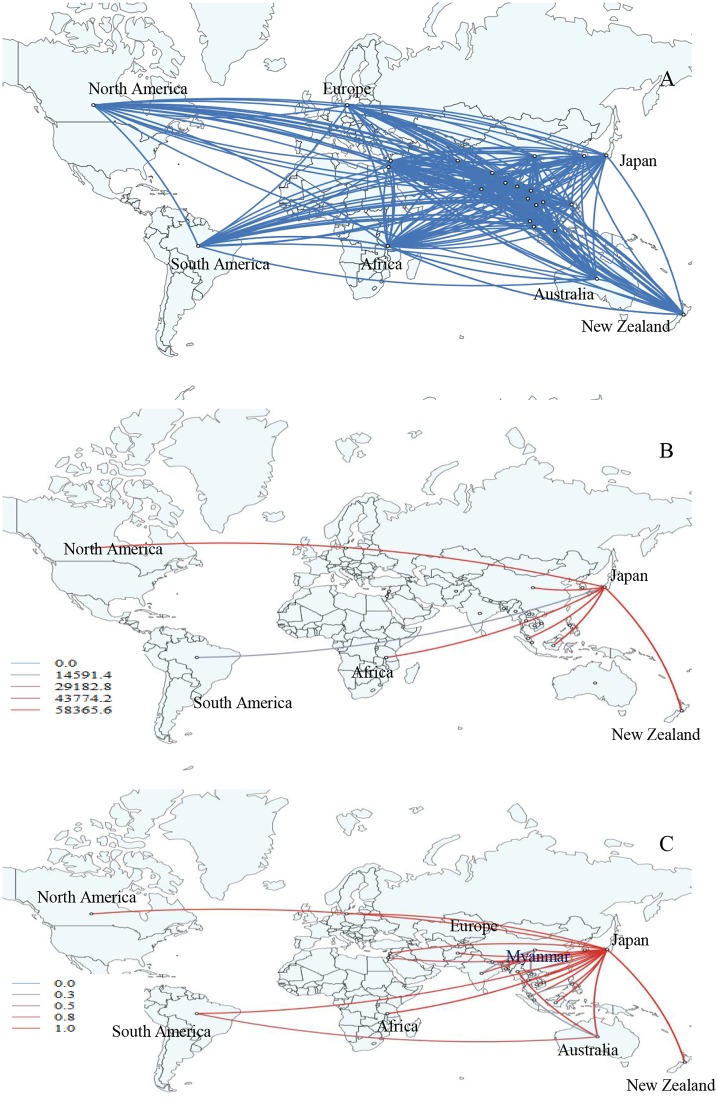
Fig 6. Global migration pathways of influenza A(H1N1)pdm09 viruses.
(A) Spread of influenza A(H1N1)pdm09 viruses from one location to another between 2010 and 2015. Blue lines indicate the connection between different locations, which represent branches in the MCC tree. (B) The color gradients (from blue to red) of the lines indicate the relative strength of connection between locations according to the Bayes Factor (BF) test. Only rates supported by a BF greater than 1000 are indicated. (C) The color gradients (from blue to red) of the lines indicate the posterior probability of viral migration among locations. Lines were displayed when the posterior probability values were above 0.3.

