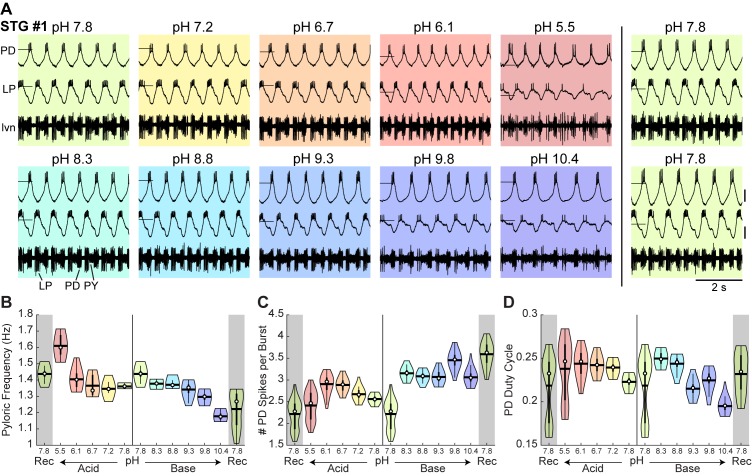
Figure 2. Robust pyloric rhythm activity across pH.
(A) Example recordings from a stomatogastric ganglion experiment with an acid-first protocol. Intracellular recordings of the PD and LP neurons and extracellular recordings of the lvn are shown. Each colored box displays 5 s of recordings taken from the last minute at each pH step. The experiment can be read left to right then top to bottom in chronological order. Horizontal lines indicate a reference membrane potential of −40 mV; vertical lines indicate a scale of 10 mV. (B) Pyloric frequency, (C) number of PD spikes per burst, and (D) PD duty cycle were calculated for the last 8 min of each pH step. Violin plots show the KDE distribution, mean, median, IQR, and 95% CI for each measure across pH conditions. Recoveries from acid and base are displayed in the shaded gray regions on the far ends of each plot.

