. 2018 Dec 28;7:e41877. doi: 10.7554/eLife.41877

Figure 3. Variability of pyloric rhythm activity at extreme pH.

(A) Two additional stomatogastric ganglion experiments displaying 3 s of intracellular PD and extracellular lvn recordings. Horizontal lines indicate a reference membrane potential of −40 mV; vertical line indicates a scale of 10 mV. (B) Five states were defined to characterize pyloric rhythm activity. Examples of activity for each state are given. (C) Stacked bars give the mean fraction of time that all 15 preparations spent in each state. (D) Pyloric rhythm frequency, (E) number of PD spikes per burst, and (F) PD duty cycle were calculated and pooled across all STG preparations for each pH step. Violin plots show the KDE distribution, mean, median, IQR, and 95% CI for each measure across pH conditions. Recoveries from acid and base are displayed in the shaded gray regions on the far ends of each plot. Asterisks denote statistical significance revealed by paired samples t-tests with Bonferroni correction (*p<0.05; **p<0.01; ***p<0.001).

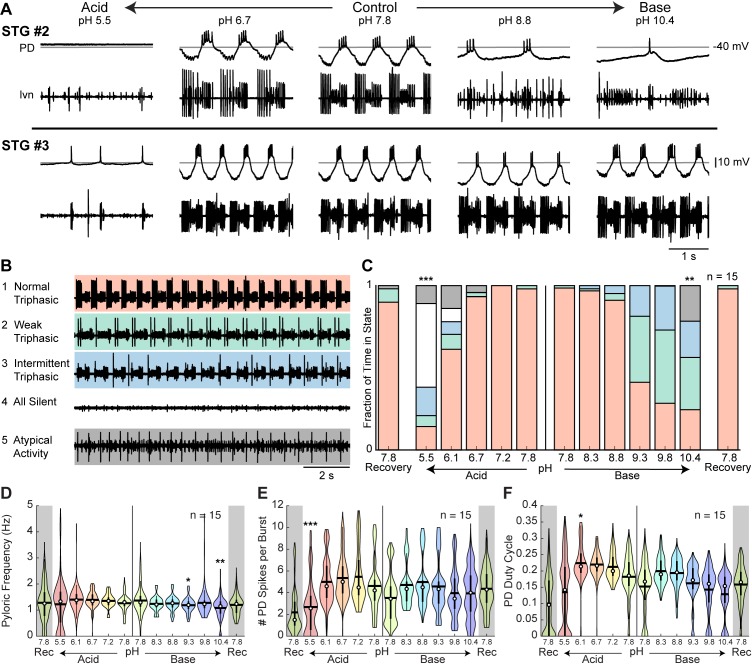
Figure 3—source data 1. Numerical data represented in panel C, D, E, and F of Figure 3 and and panel A, B, and C of Figure 3—figure supplement 2.
DOI: 10.7554/eLife.41877.008

Figure 3.

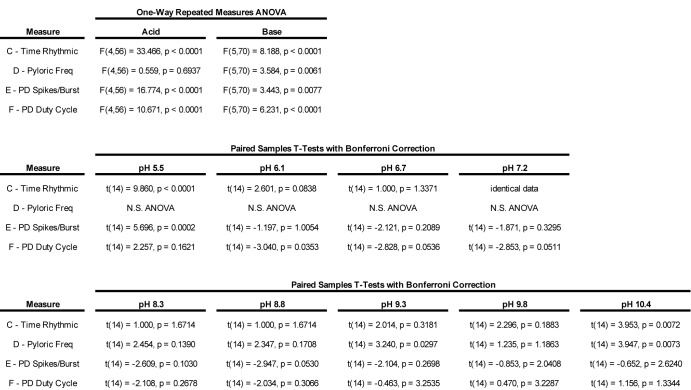
Figure 3—figure supplement 1. Statistical analysis of the effects of pH on the pyloric rhythm.

Figure 3—figure supplement 1.

The main effects of acid and base protocols on four measures of the activity of the pyloric rhythm were assessed. Univariate Type III Repeated-Measures Analysis of Variance (ANOVA) tests were performed separately for both acid and base step protocols. Post-hoc paired samples t-tests with Bonferroni correction were performed for each pH step against its respective control, the pH 7.8 condition immediately prior to the step protocol. T-statistics are not reported for non-significant ANOVAs.
Figure 3—figure supplement 2. Variability of pyloric rhythm activity at control pH.

Figure 3—figure supplement 2.

(A) Pyloric rhythm frequency, (B) number of PD spikes per burst, and (C) PD duty cycle were calculated for each CG preparation for the last 8 min in control pH 7.8. Violin plots show the KDE distribution, mean, median, IQR, and 95% CI for each measure across preparations. Preparations are consistent across plots and sorted in order of increasing frequency.