Figure 3.

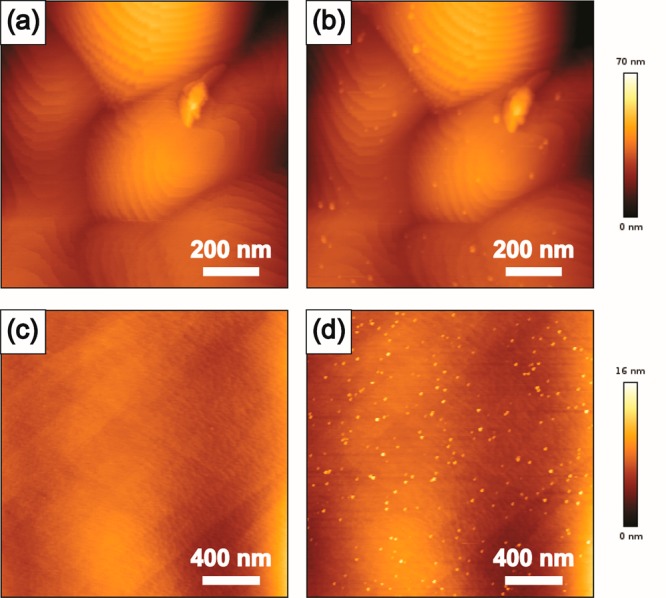
AFM height images of the Pt electrode surface after potential cycling between (a) 0.05–1.7 V, (b) 0.05–1.8 V, (c) 0.9–1.8 V, and (d) 0.8–1.8 V. Note that the scale is not the same in these images.

AFM height images of the Pt electrode surface after potential cycling between (a) 0.05–1.7 V, (b) 0.05–1.8 V, (c) 0.9–1.8 V, and (d) 0.8–1.8 V. Note that the scale is not the same in these images.