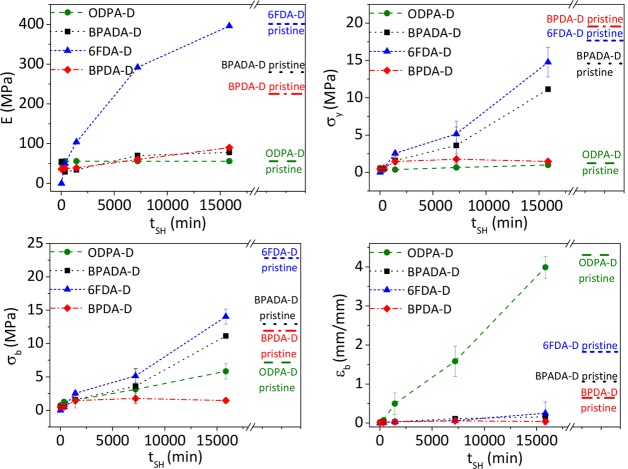
Figure 2.
Effect of the dianhydride structure on the evolution of Young modulus (E), stress at yield (σy), stress at break (σb), and strain at break (εb) with healing time (tSH) at the individual TSH. The values of the annealed undamaged samples are shown as dotted horizontal lines at the right part of each plot. It can be seen how the undamaged level of each mechanical parameter is reached at different healing times depending on the parameter and the polymer. Ttest = 23 ± 2 °C. Error bars are based on three repetitions.

